16
16peptides
spectra
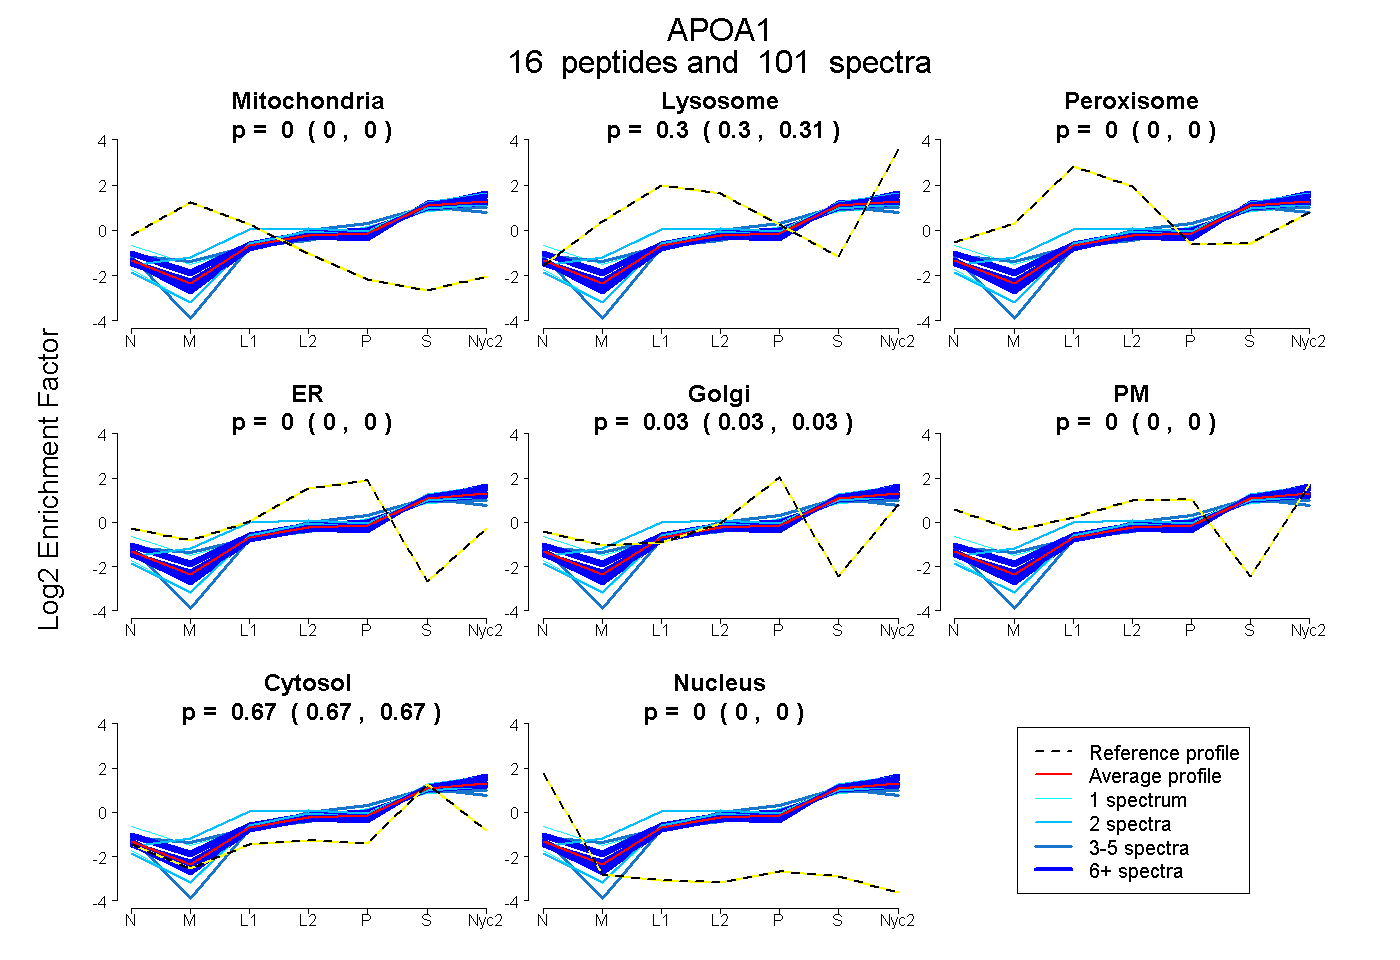
0.000 | 0.000
0.302 | 0.306
0.000 | 0.000
0.000 | 0.000
0.026 | 0.029
0.000 | 0.000
0.667 | 0.670
0.000 | 0.000
6peptides
spectra
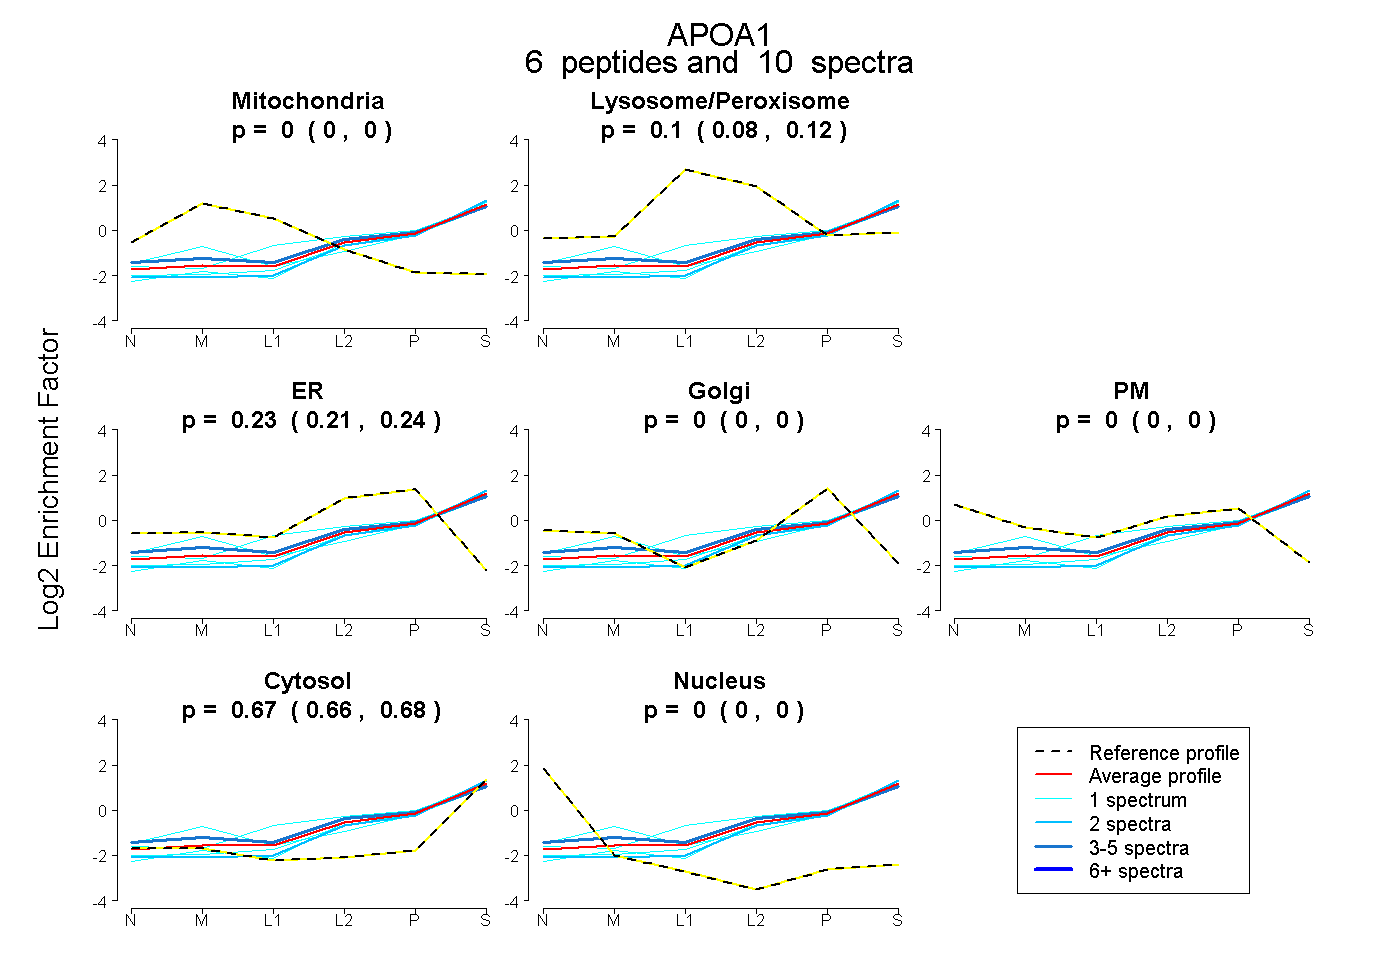
0.000 | 0.000
0.077 | 0.120
0.211 | 0.242
0.000 | 0.000
0.000 | 0.000
0.660 | 0.682
0.000 | 0.000