 1
1peptide
spectra
0.000 | 0.007
0.000 | 0.000
0.000 | 0.000
0.990 | 0.997
0.000 | 0.000
0.000 | 0.000
0.000 | 0.000
0.000 | 0.007
1peptide
spectra
0.000 | 0.000
1.000 | 1.000
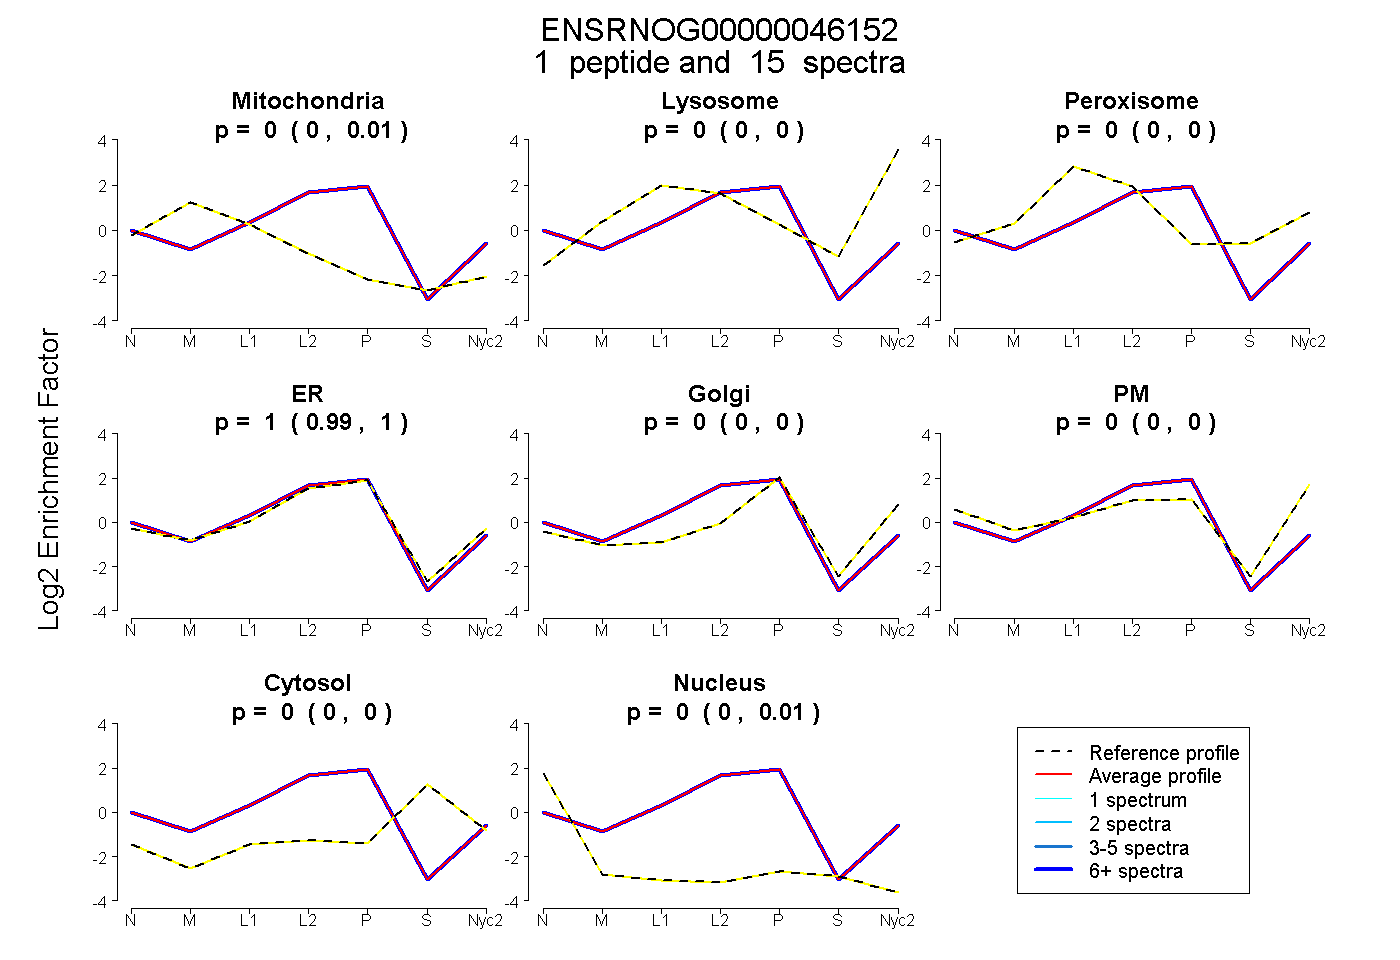
| Plot | Mito | Lyso | Perox | ER | Golgi | PM | Cytosol | Nucleus | |||||
| Expt A |
1 peptide |
15 spectra |
|
0.000 0.000 | 0.007 |
0.000 0.000 | 0.000 |
0.000 0.000 | 0.000 |
0.995 0.990 | 0.997 |
0.000 0.000 | 0.000 |
0.000 0.000 | 0.000 |
0.000 0.000 | 0.000 |
0.005 0.000 | 0.007 |
||
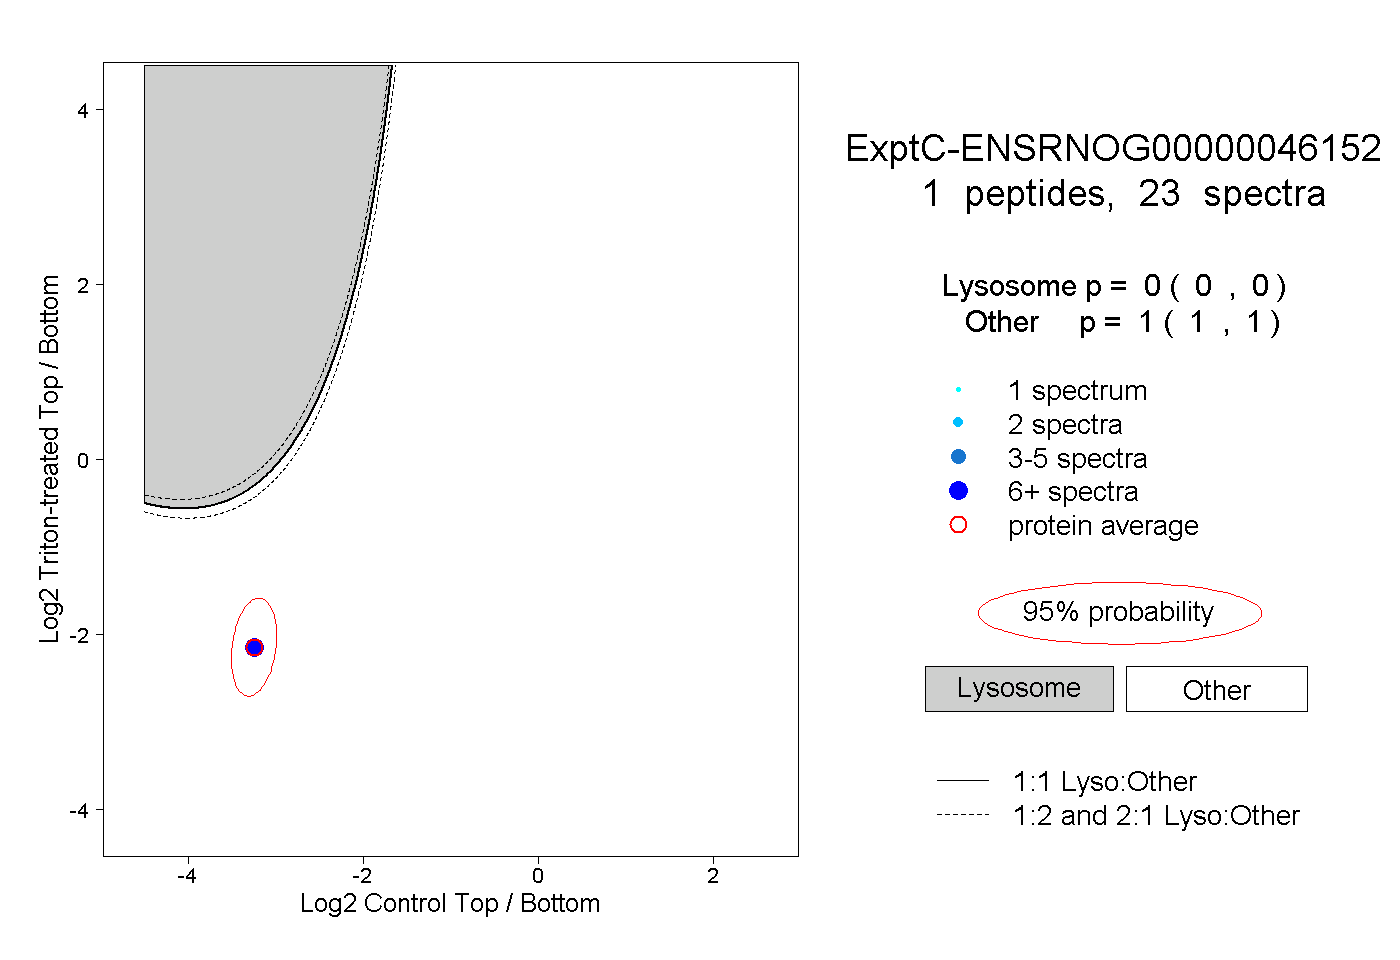
| Plot | Lyso | Other | |||||||||||
| Expt C |
1 peptide |
23 spectra |
|
0.000 0.000 | 0.000 |
1.000 1.000 | 1.000 |