 4
4peptides
spectra
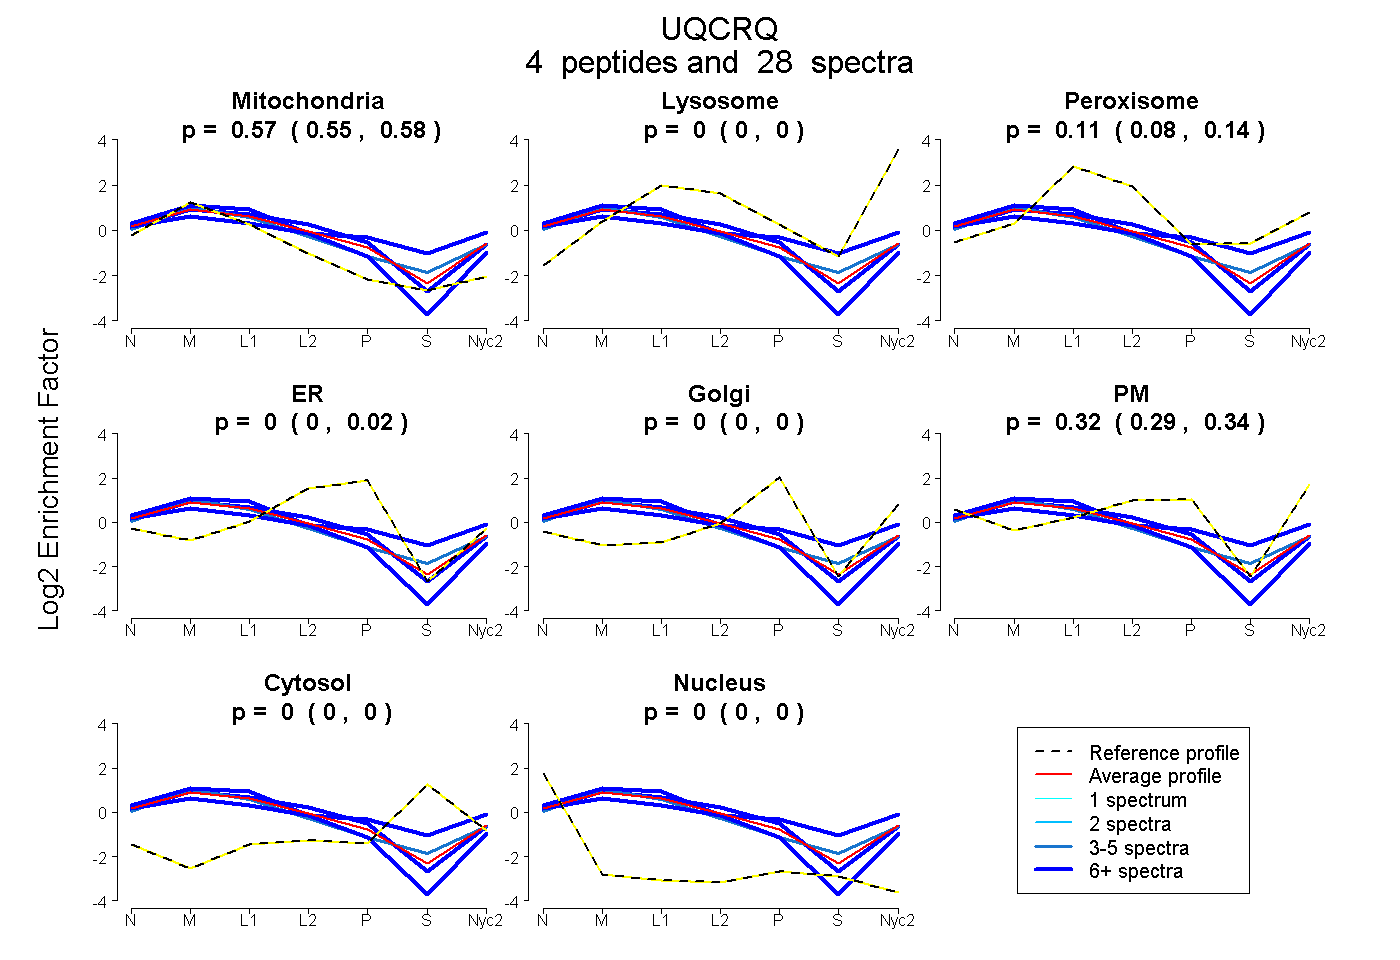
0.551 | 0.578
0.000 | 0.000
0.081 | 0.140
0.000 | 0.018
0.000 | 0.000
0.289 | 0.337
0.000 | 0.000
0.000 | 0.000
4peptides
spectra
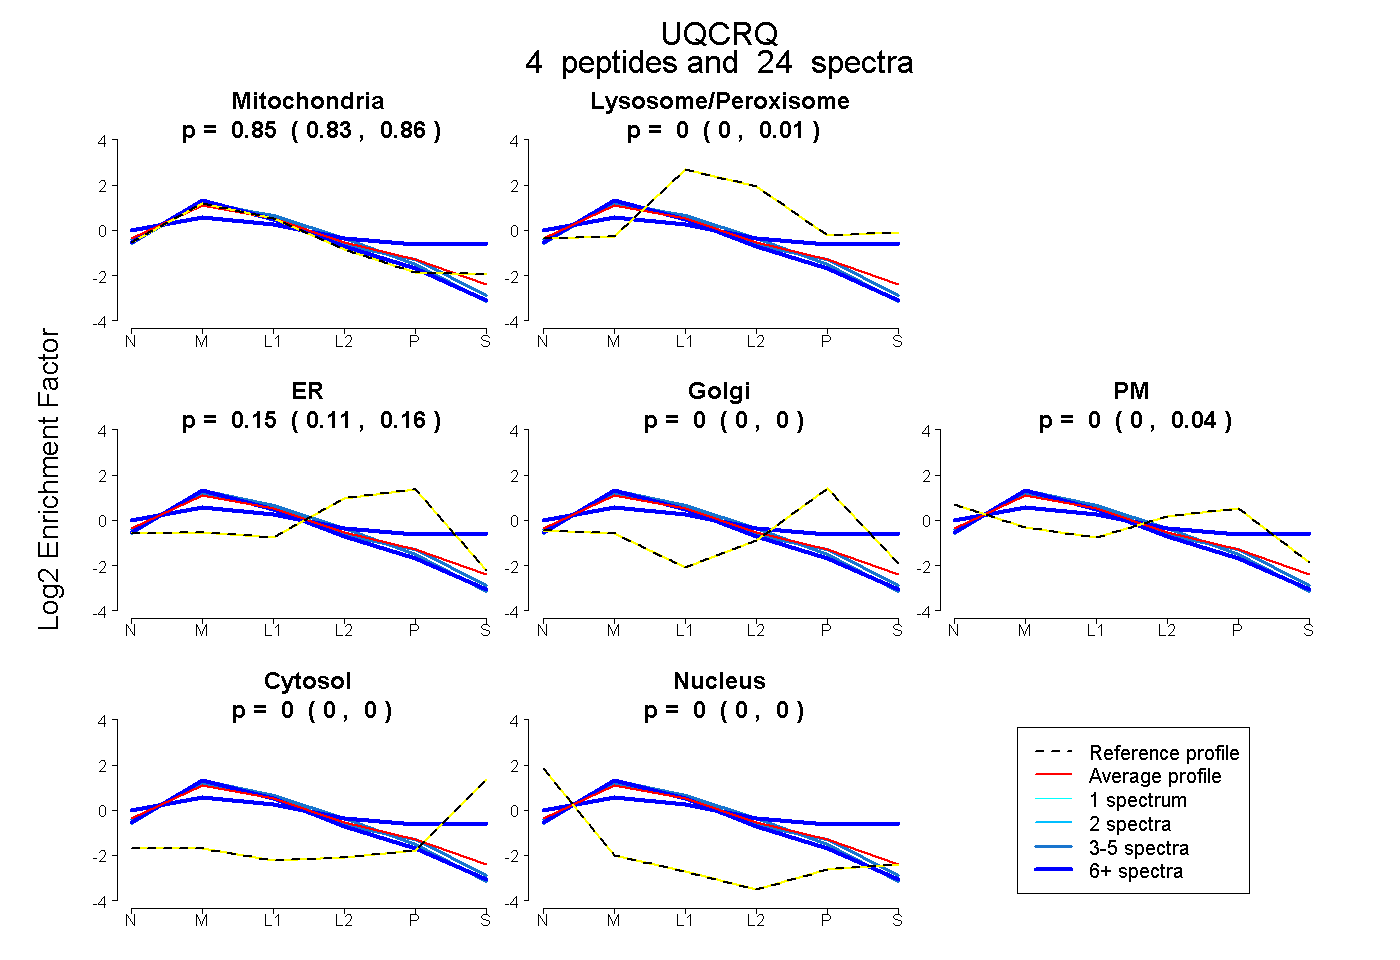
0.825 | 0.864
0.000 | 0.008
0.107 | 0.163
0.000 | 0.000
0.000 | 0.039
0.000 | 0.000
0.000 | 0.000
4peptides
spectra

0.000 | 0.000
1.000 | 1.000
2peptides
spectra
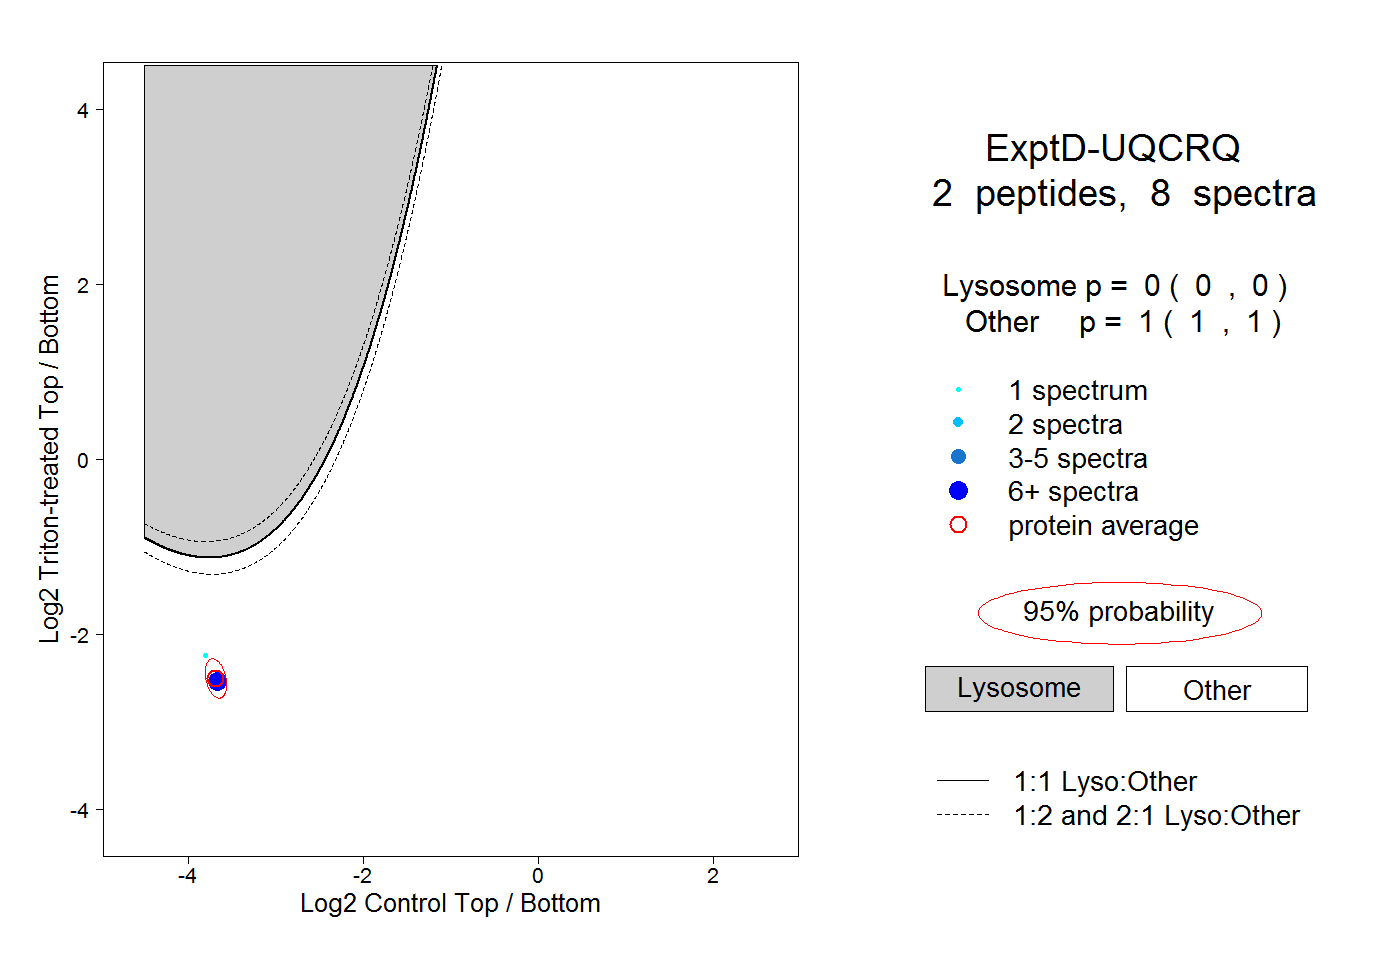
0.000 | 0.000
1.000 | 1.000