 4
4peptides
spectra
0.000 | 0.000
0.054 | 0.111
0.030 | 0.153
0.000 | 0.000
0.002 | 0.067
0.000 | 0.000
0.748 | 0.808
0.000 | 0.000
1peptide
spectra
NA | NA
NA | NA
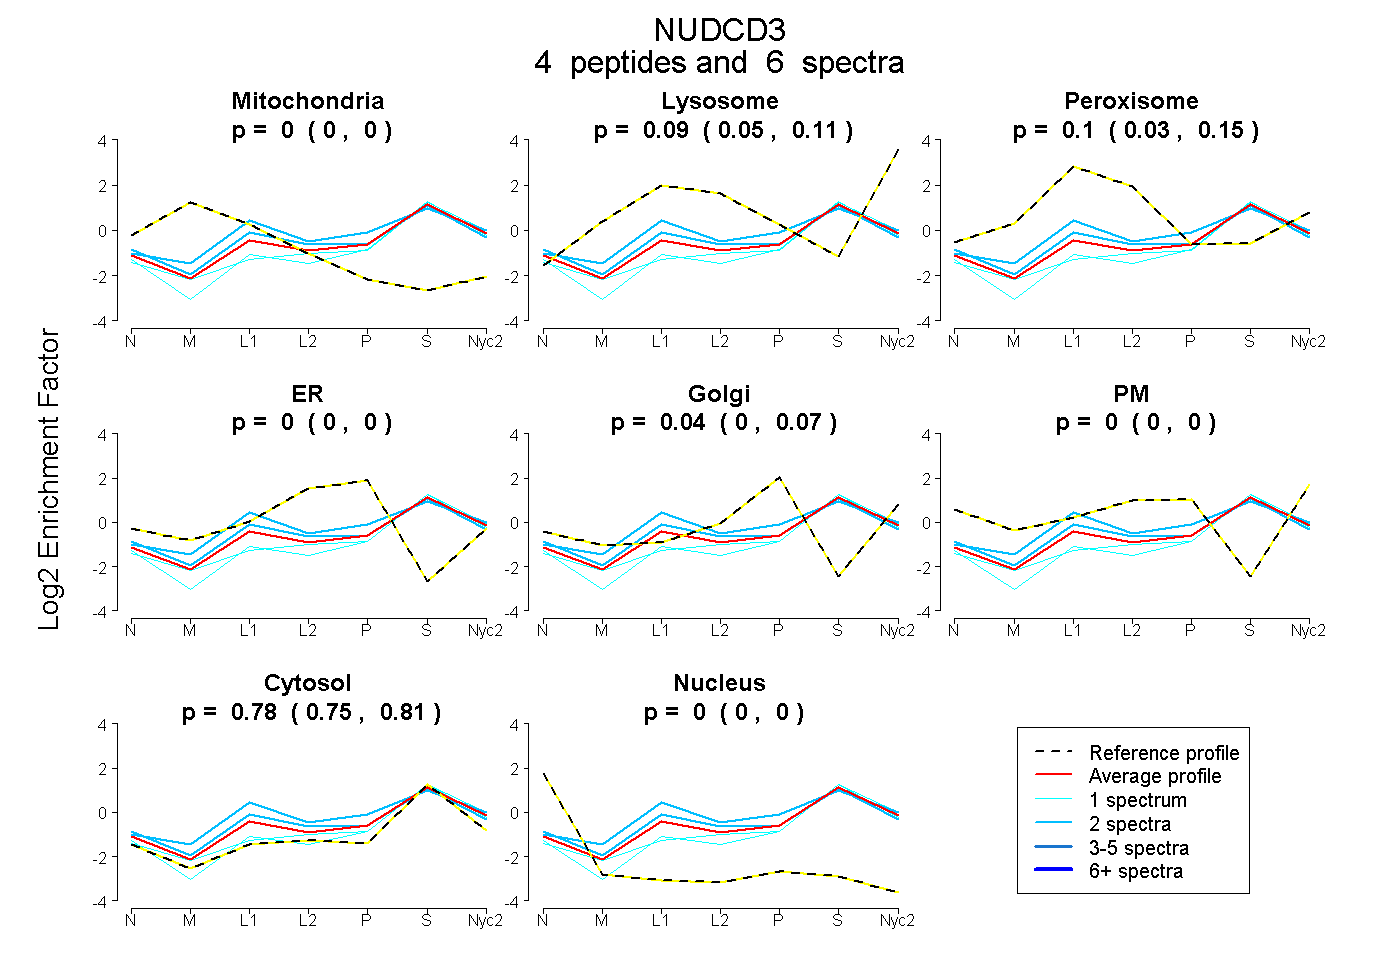
| Plot | Mito | Lyso | Perox | ER | Golgi | PM | Cytosol | Nucleus | |||||
| Expt A |
4 peptides |
6 spectra |
|
0.000 0.000 | 0.000 |
0.085 0.054 | 0.111 |
0.095 0.030 | 0.153 |
0.000 0.000 | 0.000 |
0.038 0.002 | 0.067 |
0.000 0.000 | 0.000 |
0.781 0.748 | 0.808 |
0.000 0.000 | 0.000 |
||
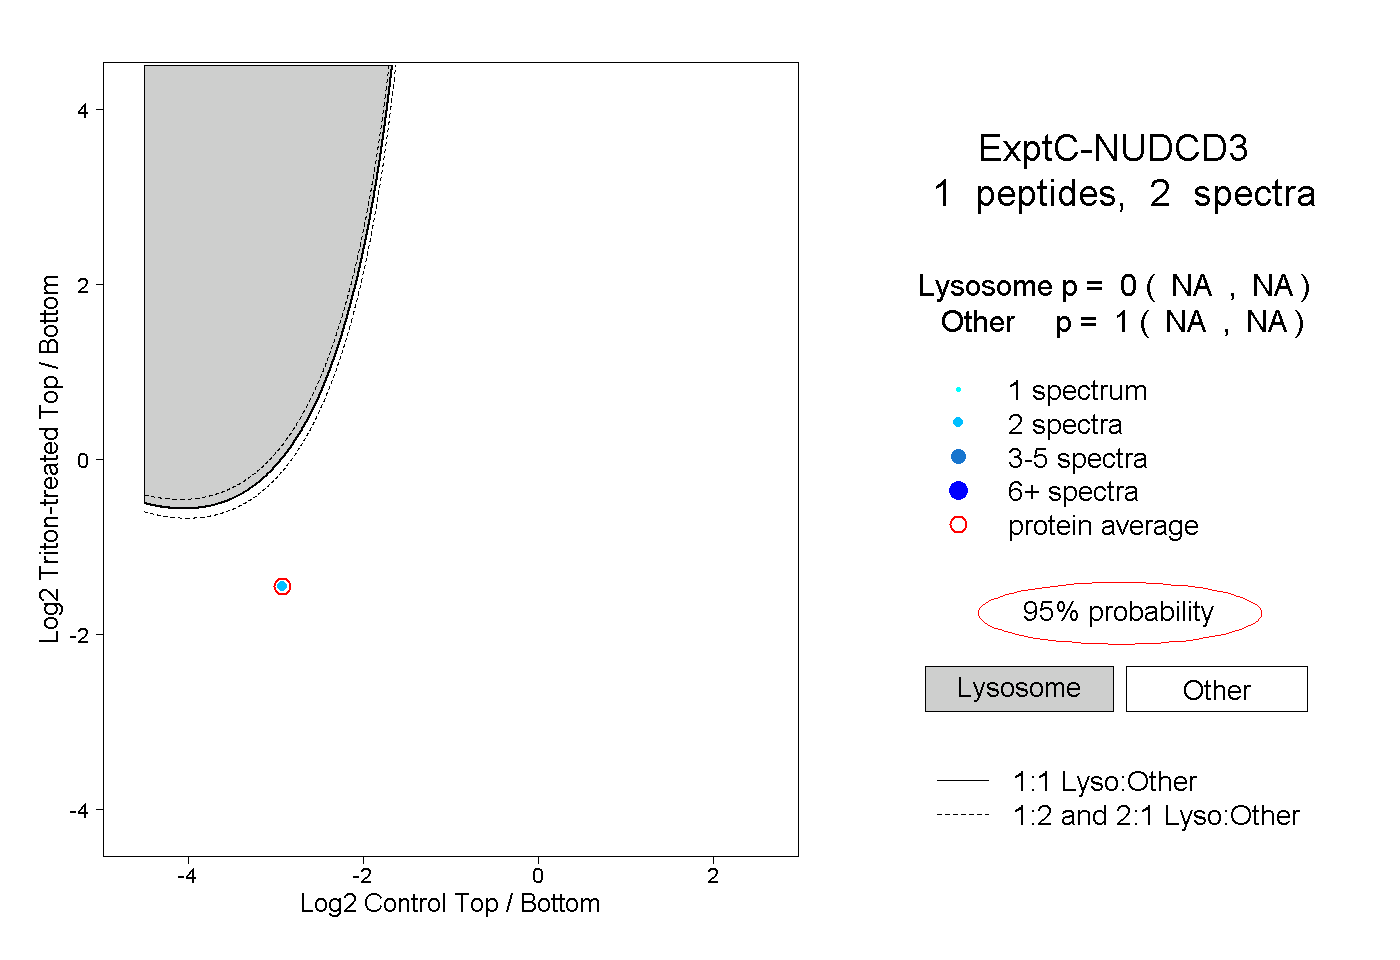
| Plot | Lyso | Other | |||||||||||
| Expt C |
1 peptide |
2 spectra |
|
0.000 NA | NA |
1.000 NA | NA |