 2
2peptides
spectra
0.000 | 0.000
0.000 | 0.000
0.000 | 0.000
0.000 | 0.208
0.000 | 0.206
0.000 | 0.000
0.073 | 0.172
0.637 | 0.742
1peptide
spectrum
NA | NA
NA | NA
NA | NA
NA | NA
NA | NA
NA | NA
NA | NA
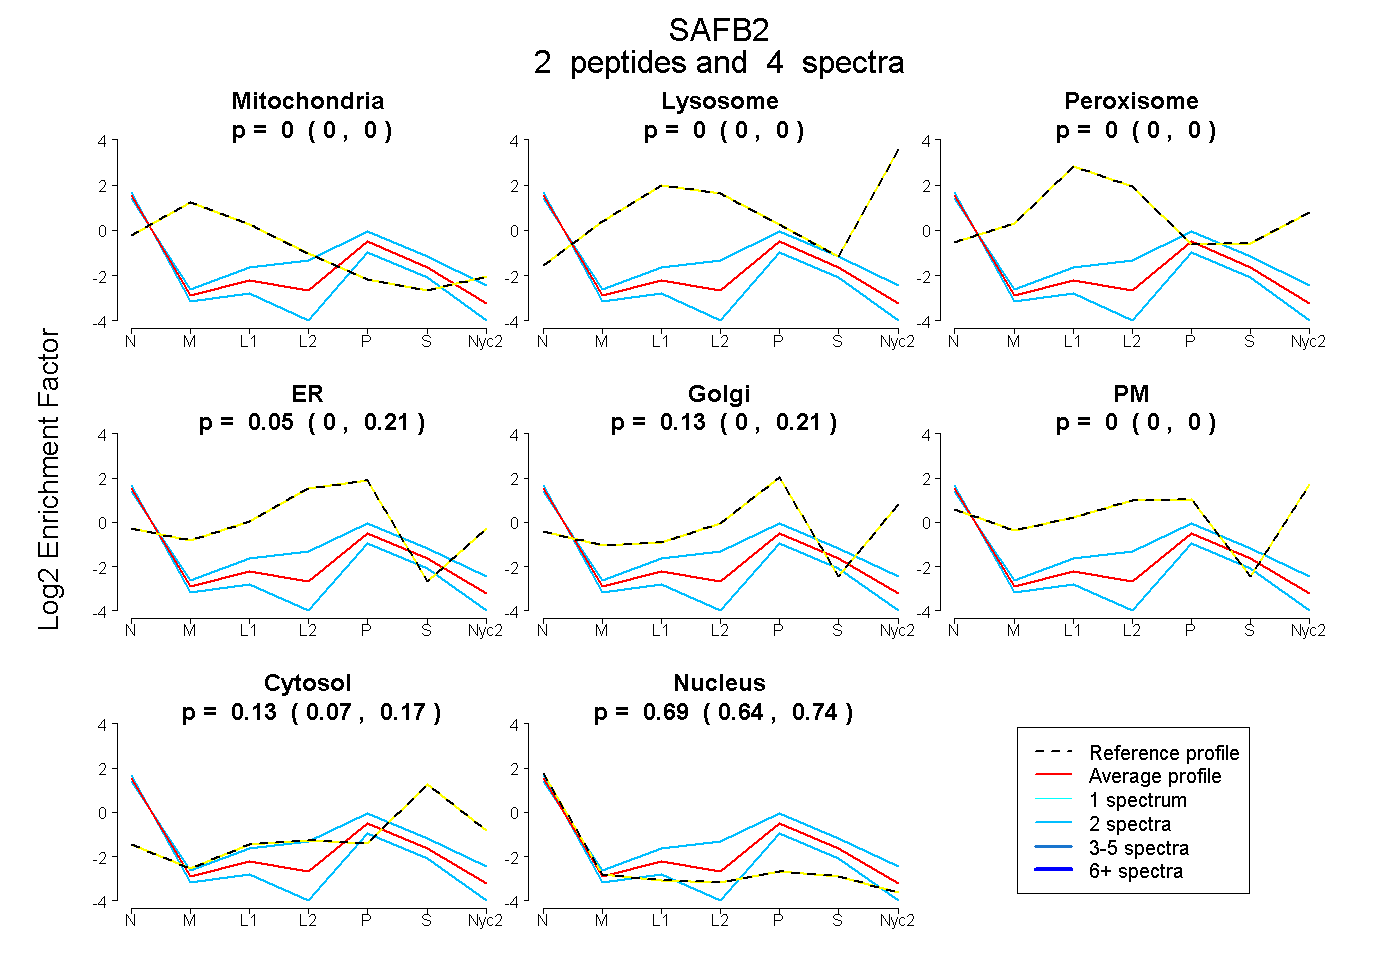
| Plot | Mito | Lyso | Perox | ER | Golgi | PM | Cytosol | Nucleus | |||||
| Expt A |
2 peptides |
4 spectra |
|
0.000 0.000 | 0.000 |
0.000 0.000 | 0.000 |
0.000 0.000 | 0.000 |
0.049 0.000 | 0.208 |
0.128 0.000 | 0.206 |
0.000 0.000 | 0.000 |
0.129 0.073 | 0.172 |
0.694 0.637 | 0.742 |
||
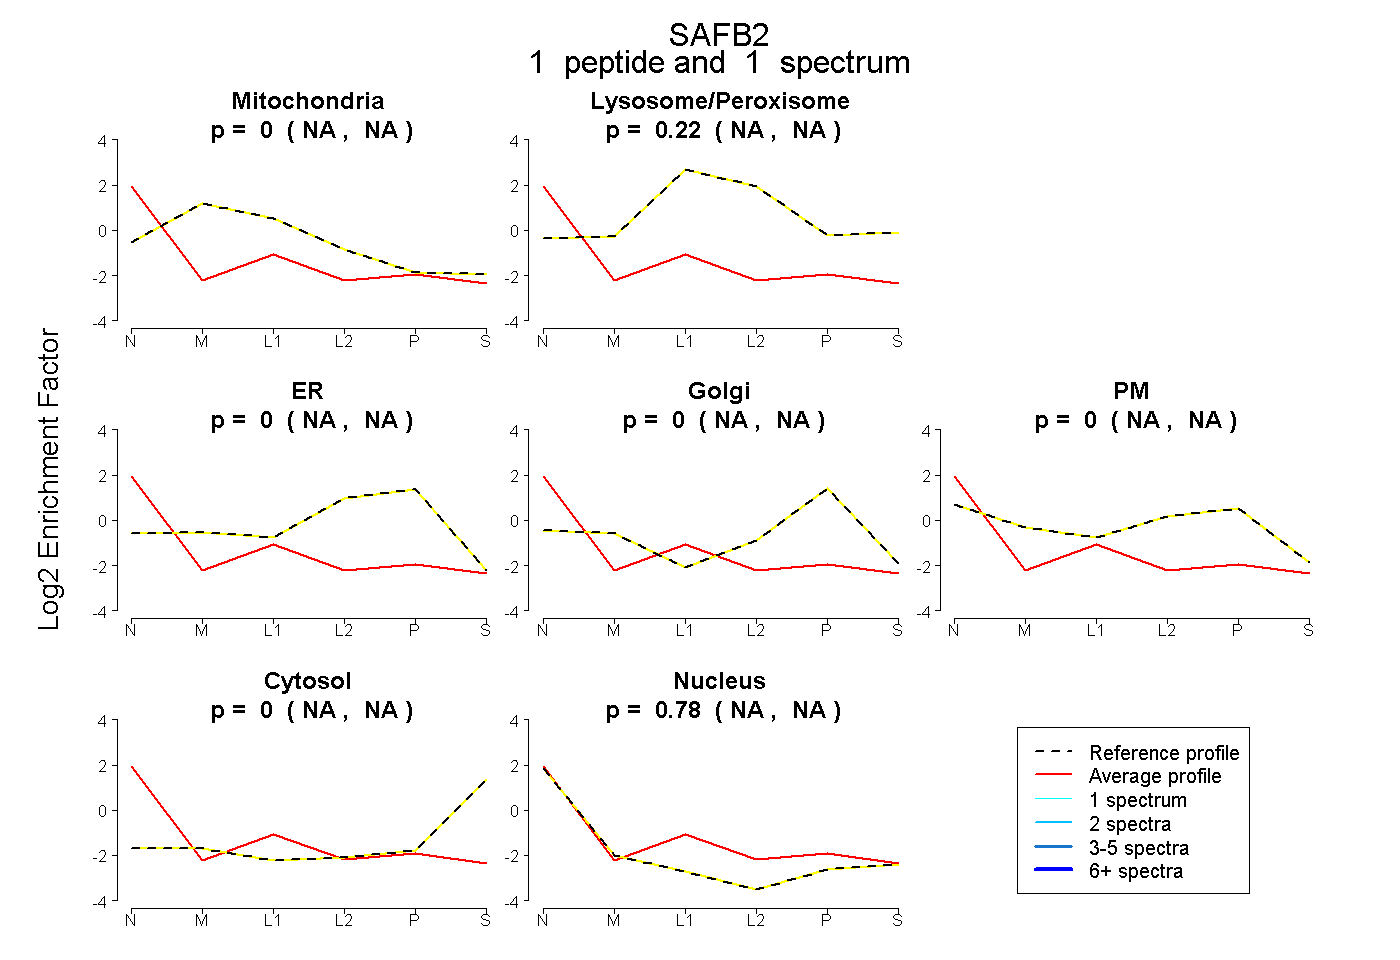
| Plot | Mito | Lyso or Perox | ER | Golgi | PM | Cytosol | Nucleus | ||||||
| Expt B |
1 peptide |
1 spectrum |
|
0.000 NA | NA |
0.217 NA | NA |
0.000 NA | NA |
0.000 NA | NA |
0.000 NA | NA |
0.000 NA | NA |
0.783 NA | NA |