 4
4peptides
spectra
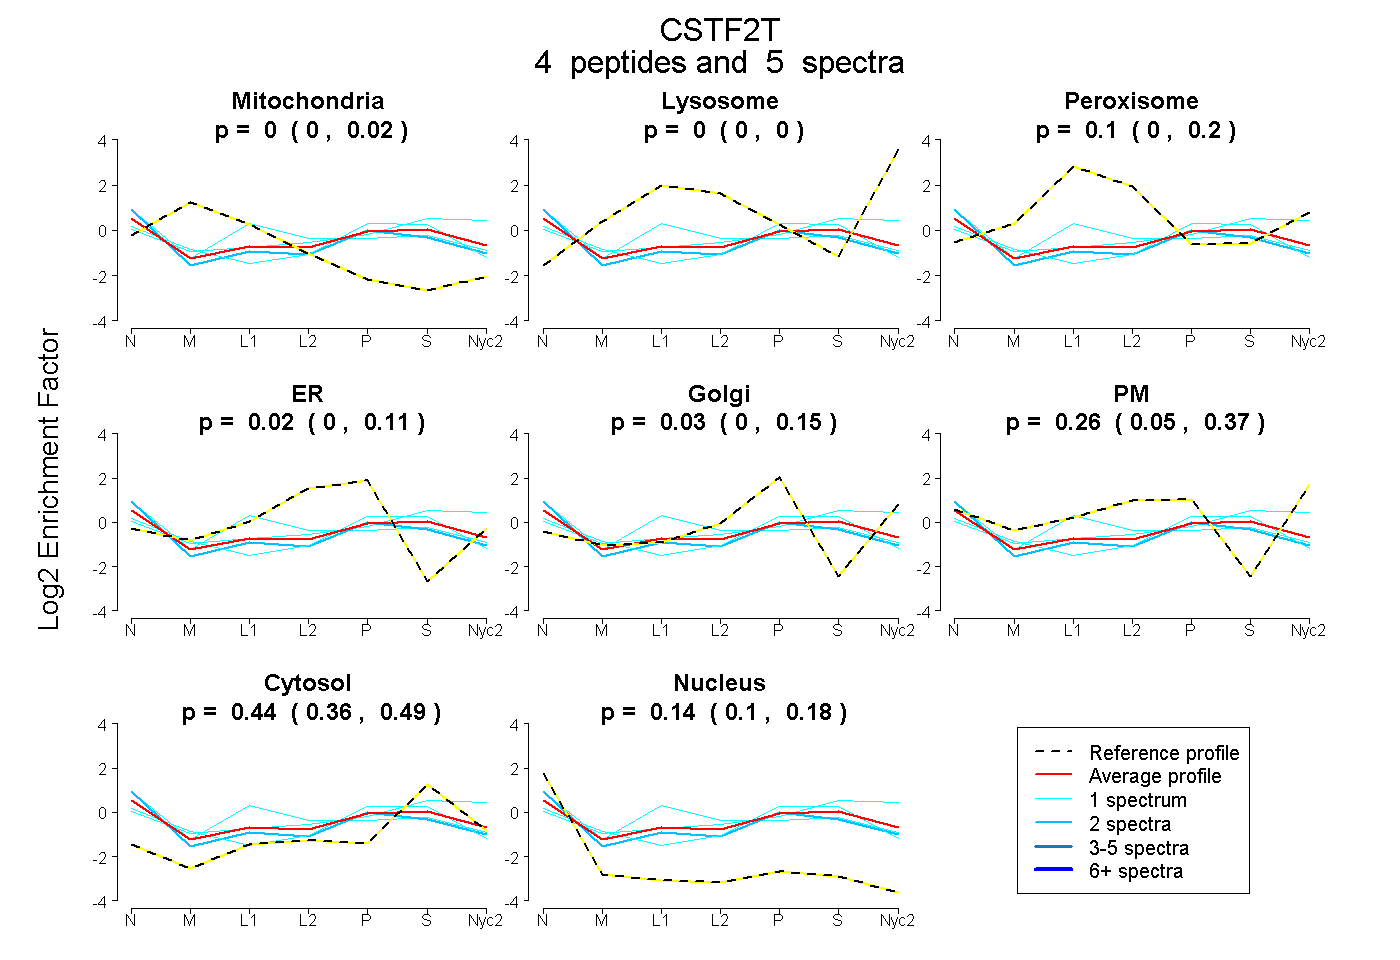
0.000 | 0.018
0.000 | 0.000
0.002 | 0.198
0.000 | 0.108
0.000 | 0.146
0.052 | 0.371
0.363 | 0.495
0.097 | 0.177
| Plot | Mito | Lyso | Perox | ER | Golgi | PM | Cytosol | Nucleus | |||||
| Expt A |
4 peptides |
5 spectra |
|
0.000 0.000 | 0.018 |
0.000 0.000 | 0.000 |
0.100 0.002 | 0.198 |
0.021 0.000 | 0.108 |
0.032 0.000 | 0.146 |
0.263 0.052 | 0.371 |
0.439 0.363 | 0.495 |
0.144 0.097 | 0.177 |
| 1 spectrum, LCVQNSHQEAR | 0.097 | 0.000 | 0.000 | 0.056 | 0.272 | 0.000 | 0.496 | 0.078 | ||
| 1 spectrum, GGTLLSVTGEVEPR | 0.000 | 0.000 | 0.045 | 0.000 | 0.000 | 0.386 | 0.569 | 0.000 | ||
| 1 spectrum, GGPLAADPR | 0.000 | 0.000 | 0.393 | 0.024 | 0.000 | 0.109 | 0.228 | 0.246 | ||
| 2 spectra, IMDPEIALK | 0.000 | 0.000 | 0.030 | 0.067 | 0.017 | 0.274 | 0.381 | 0.231 |
| Plot | Lyso | Other | |||||||||||
| Expt C |
1 peptide |
1 spectrum |
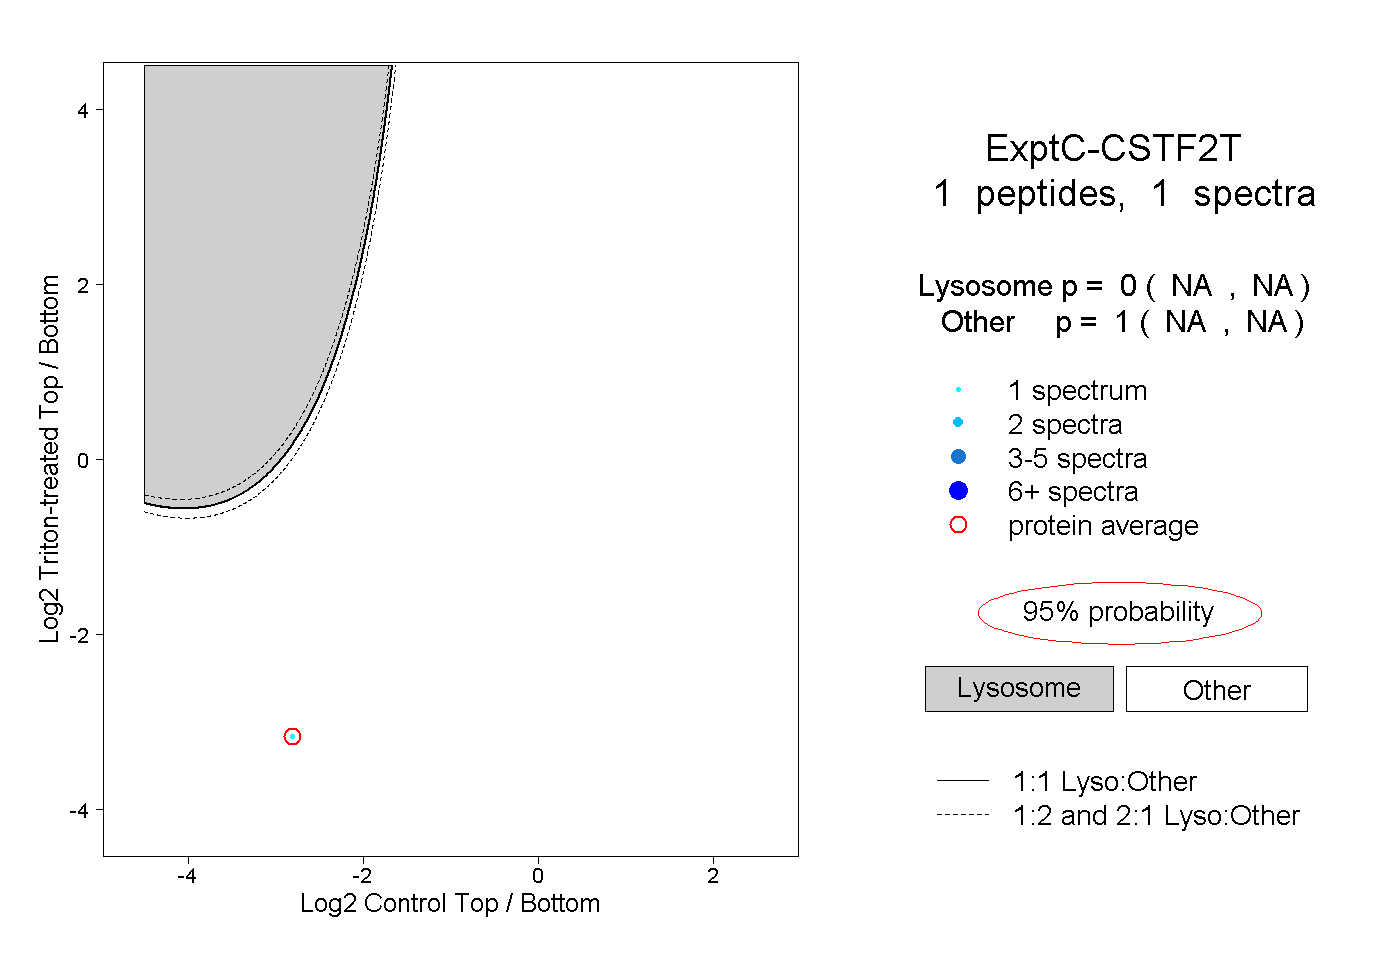 |
0.000 NA | NA |
1.000 NA | NA |