 4
4peptides
spectra
0.000 | 0.000
0.399 | 0.527
0.000 | 0.000
0.000 | 0.000
0.000 | 0.022
0.367 | 0.545
0.012 | 0.112
0.000 | 0.000
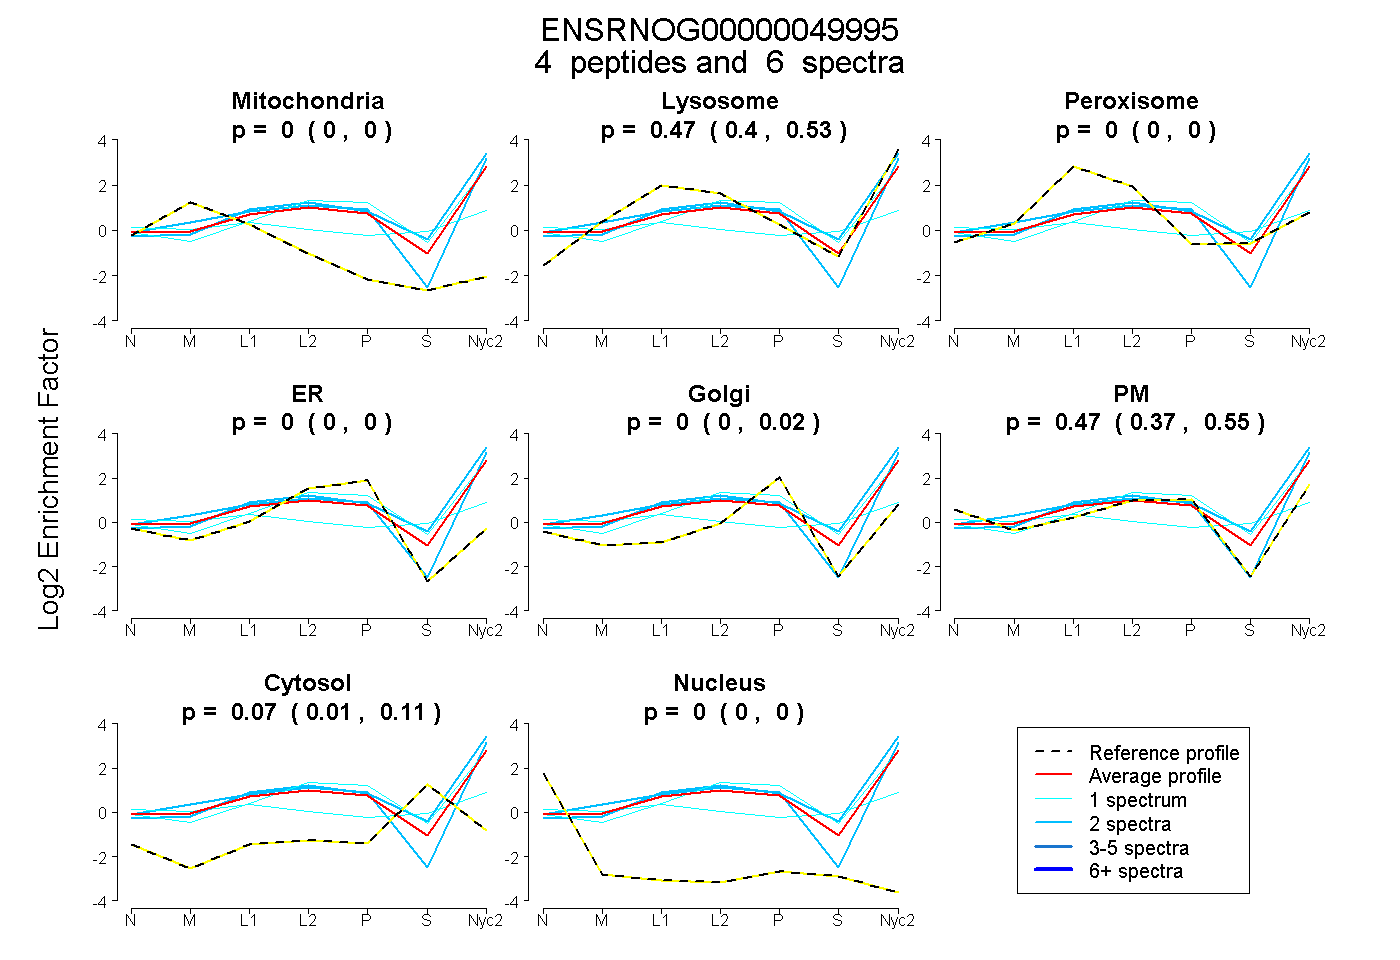
| Plot | Mito | Lyso | Perox | ER | Golgi | PM | Cytosol | Nucleus | |||||
| Expt A |
4 peptides |
6 spectra |
|
0.000 0.000 | 0.000 |
0.467 0.399 | 0.527 |
0.000 0.000 | 0.000 |
0.000 0.000 | 0.000 |
0.000 0.000 | 0.022 |
0.466 0.367 | 0.545 |
0.067 0.012 | 0.112 |
0.000 0.000 | 0.000 |
| 2 spectra, DWIVVVAGENR | 0.000 | 0.407 | 0.000 | 0.000 | 0.000 | 0.593 | 0.000 | 0.000 | ||
| 1 spectrum, VEESELK | 0.000 | 0.450 | 0.000 | 0.000 | 0.037 | 0.418 | 0.096 | 0.000 | ||
| 2 spectra, LADMNATIR | 0.000 | 0.648 | 0.000 | 0.000 | 0.000 | 0.277 | 0.075 | 0.000 | ||
| 1 spectrum, EVTDESQPNTSVV | 0.065 | 0.088 | 0.227 | 0.000 | 0.000 | 0.316 | 0.304 | 0.000 |