 11
11peptides
spectra
0.000 | 0.000
0.000 | 0.000
0.244 | 0.258
0.153 | 0.165
0.000 | 0.000
0.000 | 0.000
0.227 | 0.240
0.349 | 0.360
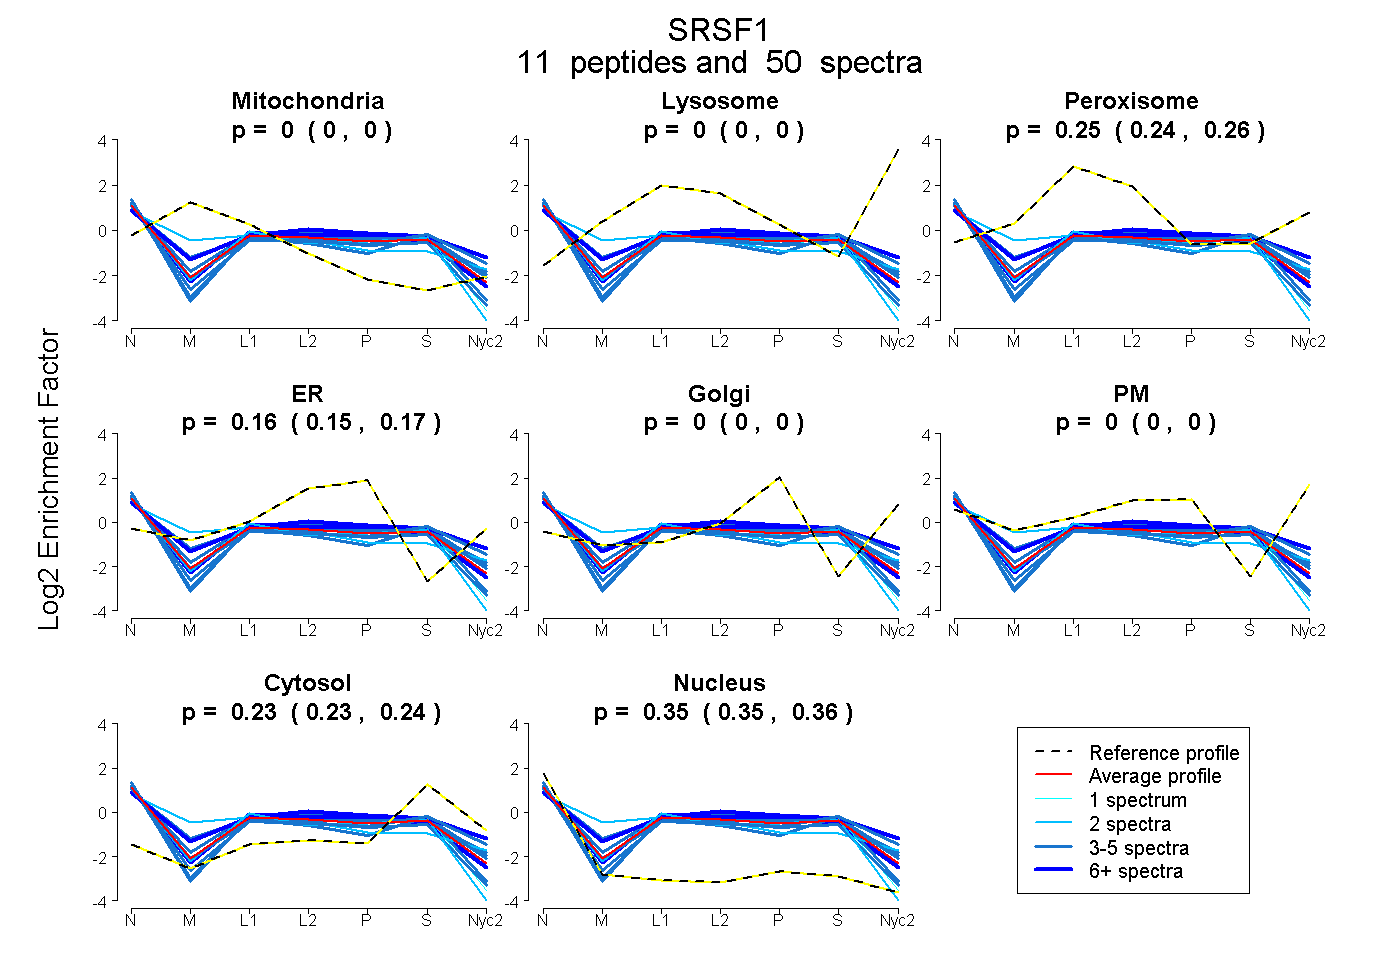
| Plot | Mito | Lyso | Perox | ER | Golgi | PM | Cytosol | Nucleus | |||||
| Expt A |
11 peptides |
50 spectra |
|
0.000 0.000 | 0.000 |
0.000 0.000 | 0.000 |
0.251 0.244 | 0.258 |
0.160 0.153 | 0.165 |
0.000 0.000 | 0.000 |
0.000 0.000 | 0.000 |
0.234 0.227 | 0.240 |
0.355 0.349 | 0.360 |
| 1 spectrum, GGPPFAFVEFEDPR | 0.000 | 0.000 | 0.187 | 0.098 | 0.000 | 0.000 | 0.276 | 0.438 | ||
| 5 spectra, DGTGVVEFVR | 0.000 | 0.000 | 0.264 | 0.221 | 0.000 | 0.000 | 0.214 | 0.301 | ||
| 3 spectra, DAEDAVYGR | 0.000 | 0.000 | 0.298 | 0.169 | 0.000 | 0.000 | 0.227 | 0.306 | ||
| 12 spectra, DGYDYDGYR | 0.000 | 0.000 | 0.217 | 0.235 | 0.000 | 0.000 | 0.196 | 0.352 | ||
| 2 spectra, VVVSGLPPSGSWQDLK | 0.000 | 0.000 | 0.241 | 0.106 | 0.000 | 0.000 | 0.182 | 0.471 | ||
| 4 spectra, YGPPSR | 0.000 | 0.000 | 0.261 | 0.122 | 0.000 | 0.000 | 0.312 | 0.305 | ||
| 2 spectra, EAGDVCYADVYR | 0.149 | 0.000 | 0.333 | 0.100 | 0.000 | 0.000 | 0.106 | 0.312 | ||
| 7 spectra, SHEGETAYIR | 0.000 | 0.000 | 0.284 | 0.237 | 0.000 | 0.000 | 0.260 | 0.219 | ||
| 5 spectra, IYVGNLPPDIR | 0.000 | 0.000 | 0.157 | 0.217 | 0.000 | 0.000 | 0.304 | 0.322 | ||
| 4 spectra, DIEDVFYK | 0.000 | 0.000 | 0.236 | 0.027 | 0.000 | 0.000 | 0.289 | 0.447 | ||
| 5 spectra, GPAGNNDCR | 0.000 | 0.000 | 0.186 | 0.140 | 0.000 | 0.000 | 0.215 | 0.459 |
| Plot | Mito | Lyso or Perox | ER | Golgi | PM | Cytosol | Nucleus | ||||||
| Expt B |
6 peptides |
13 spectra |
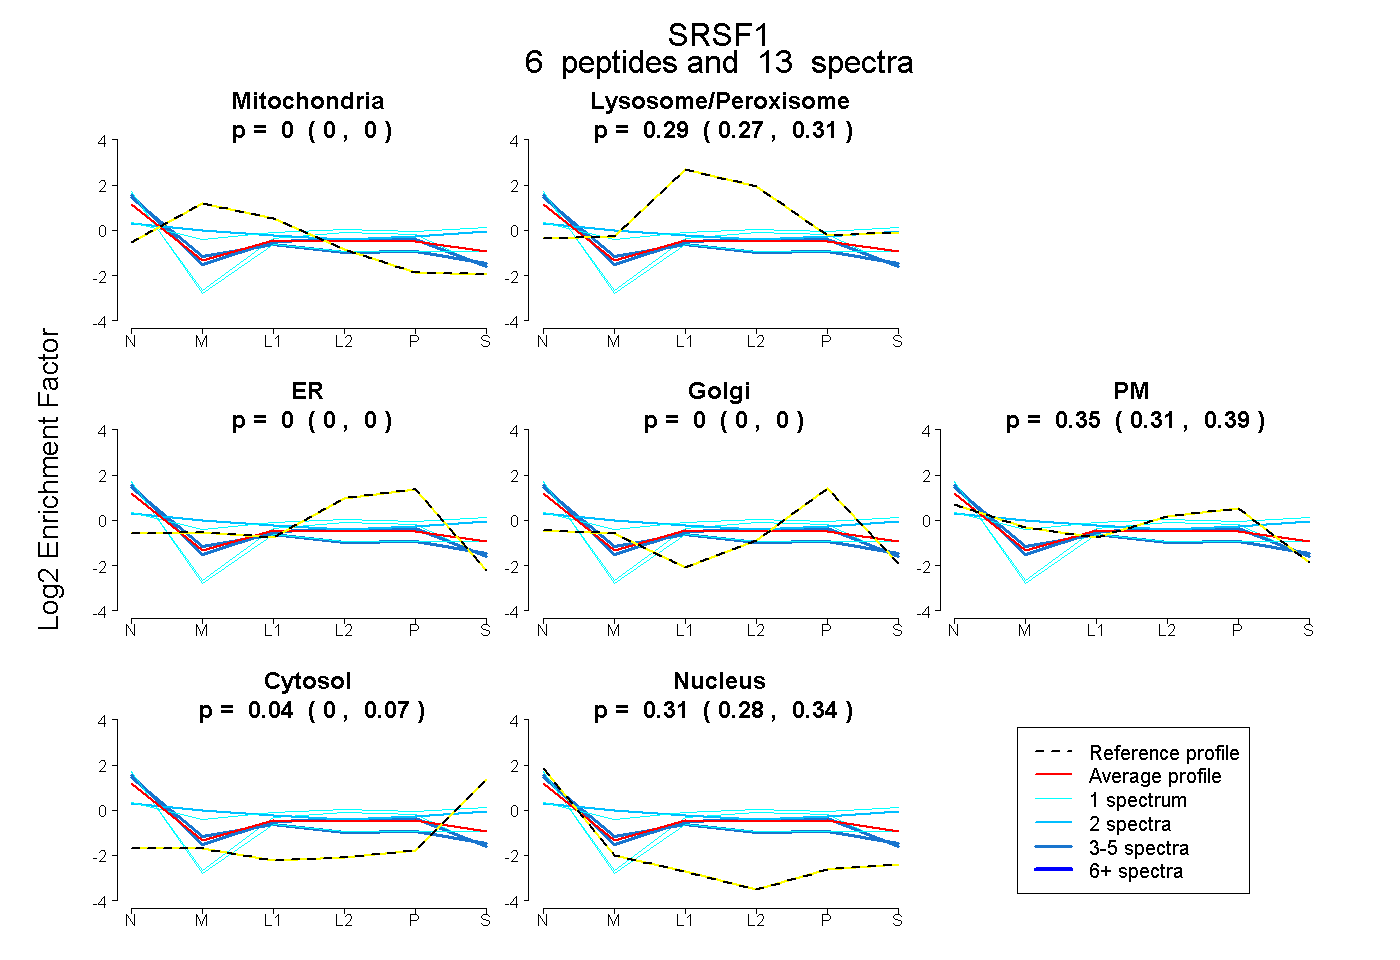 |
0.000 0.000 | 0.000 |
0.294 0.275 | 0.309 |
0.000 0.000 | 0.000 |
0.000 0.000 | 0.000 |
0.352 0.308 | 0.387 |
0.041 0.005 | 0.069 |
0.313 0.282 | 0.340 |
|||
| Plot | Lyso | Other | |||||||||||
| Expt C |
9 peptides |
67 spectra |
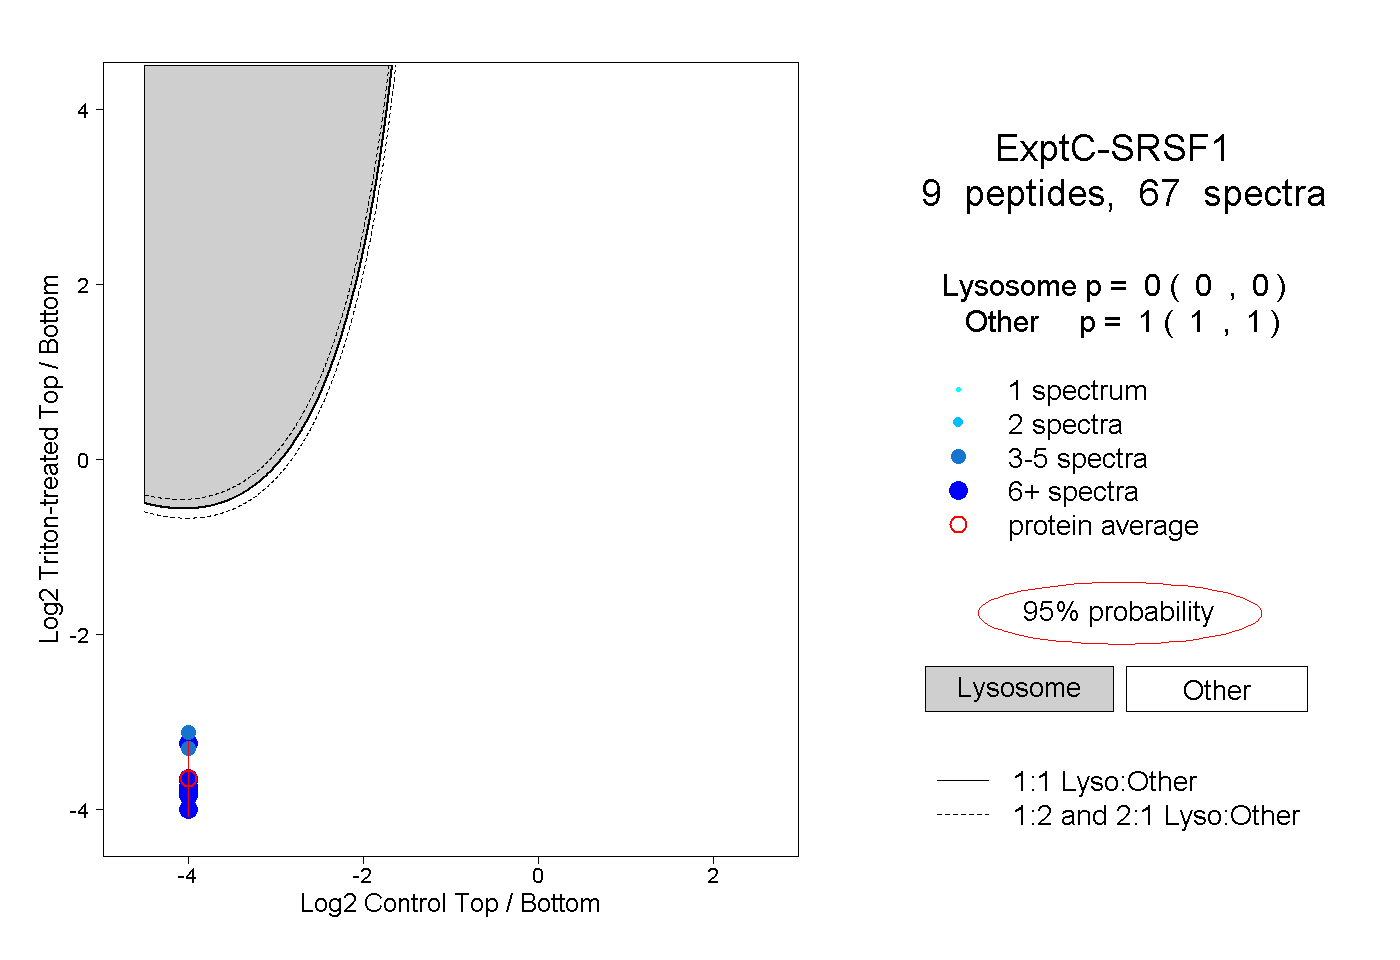 |
0.000 0.000 | 0.000 |
1.000 1.000 | 1.000 |
||||||||
| Plot | Lyso | Other | |||||||||||
| Expt D |
3 peptides |
7 spectra |
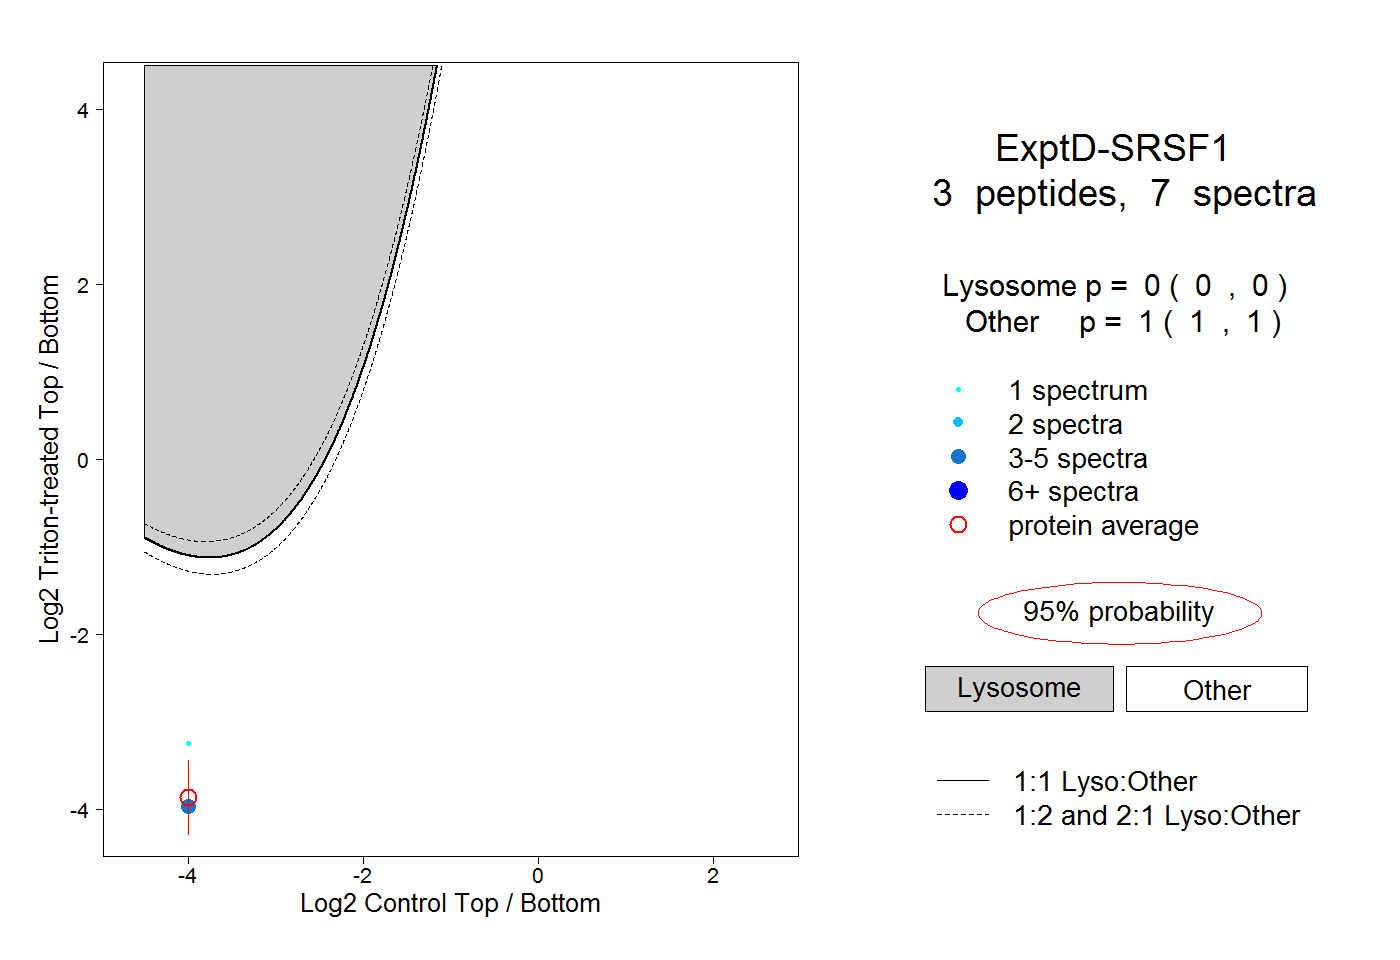 |
0.000 0.000 | 0.000 |
1.000 1.000 | 1.000 |