 5
5peptides
spectra
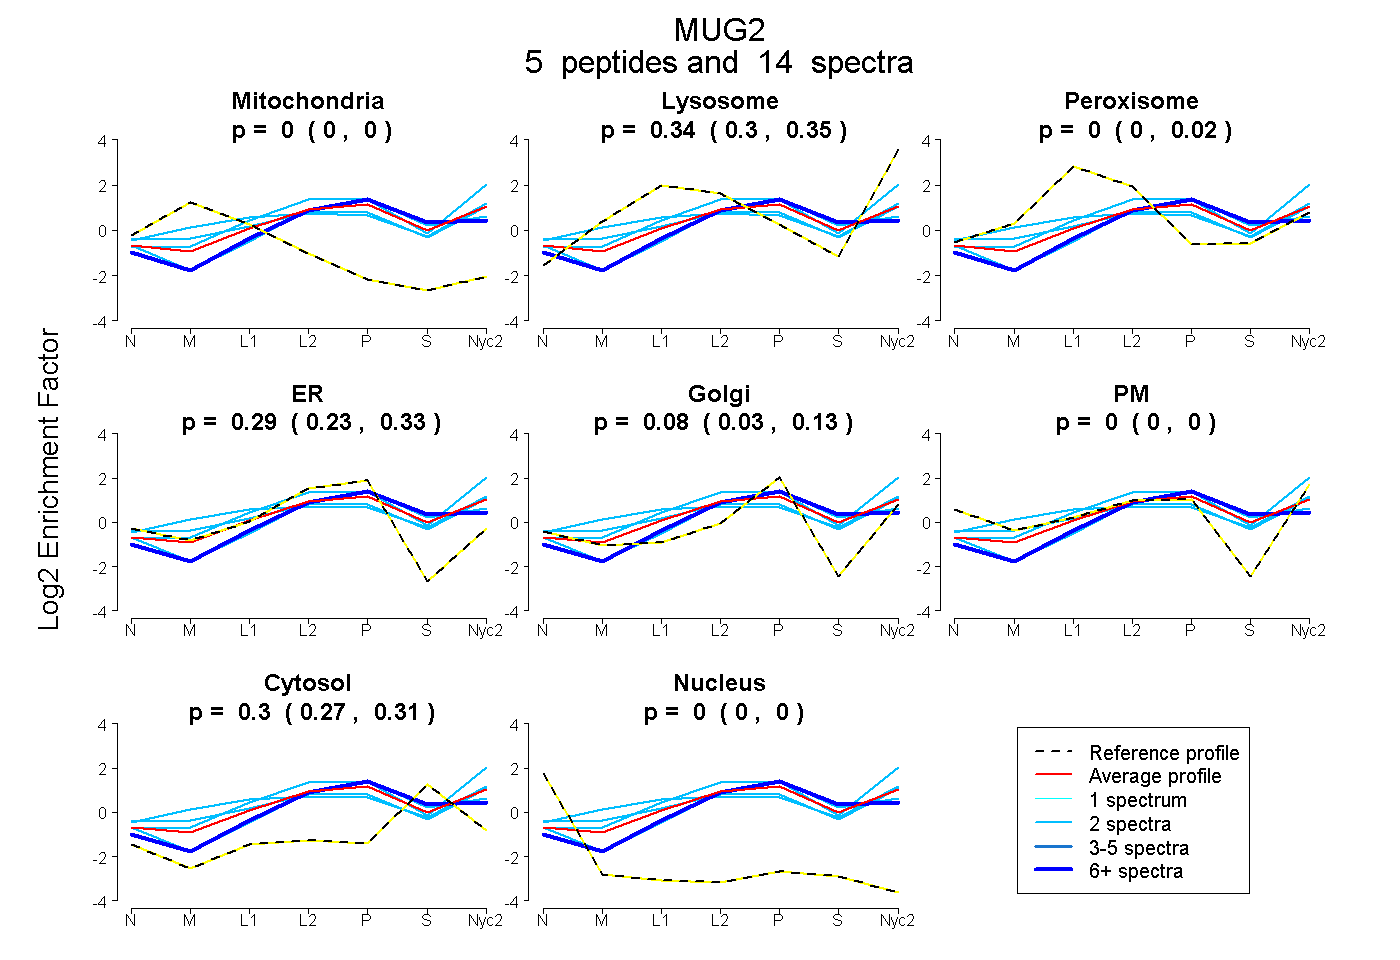
0.000 | 0.000
0.304 | 0.354
0.000 | 0.019
0.234 | 0.332
0.032 | 0.125
0.000 | 0.000
0.275 | 0.312
0.000 | 0.000
1peptide
spectra
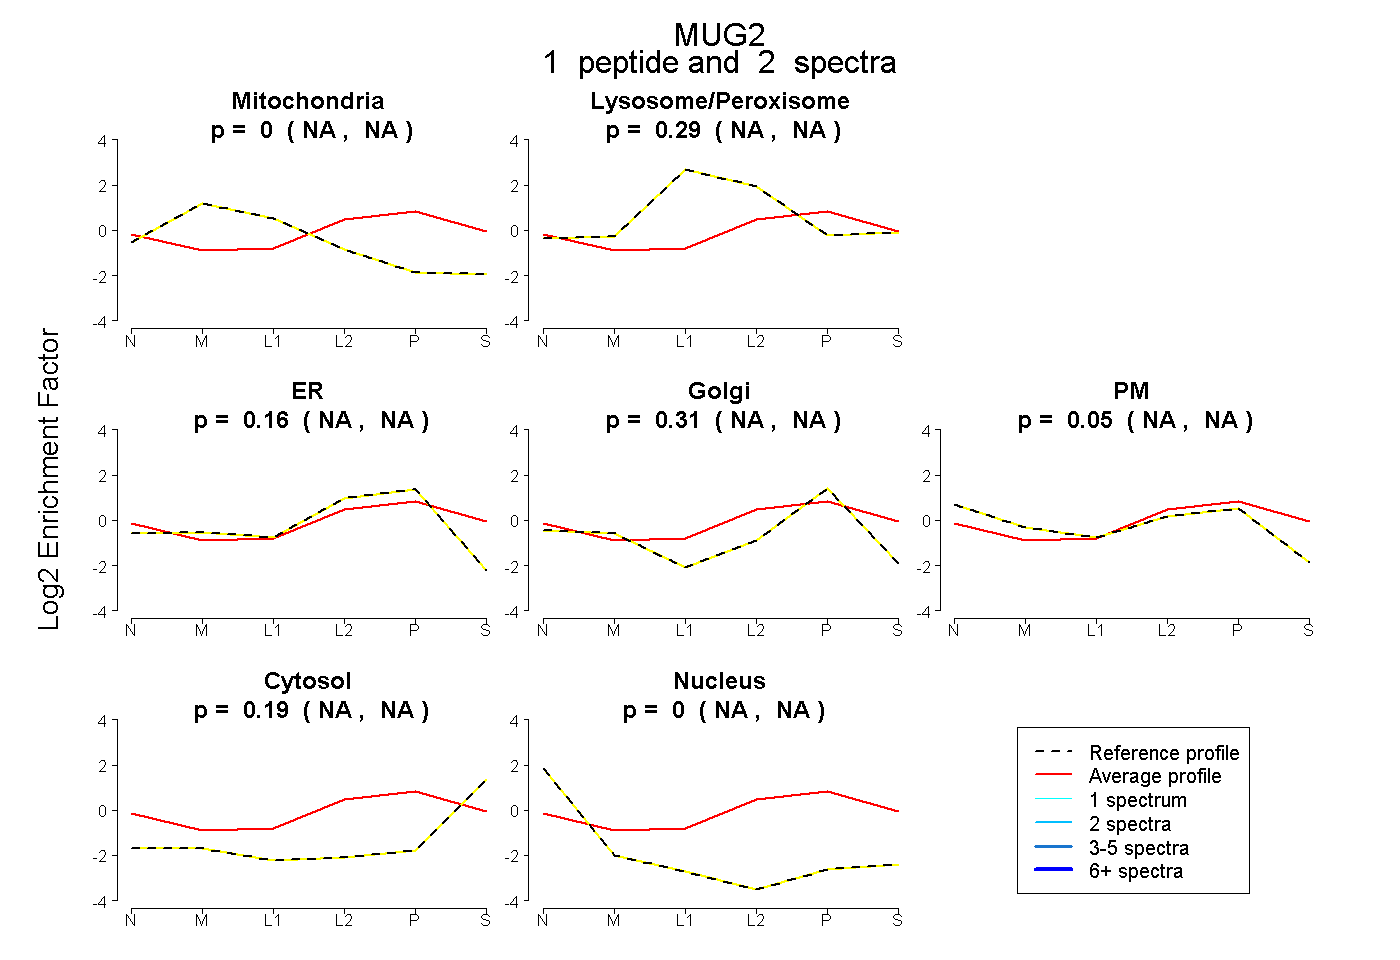
NA | NA
NA | NA
NA | NA
NA | NA
NA | NA
NA | NA
NA | NA
5peptides
spectra
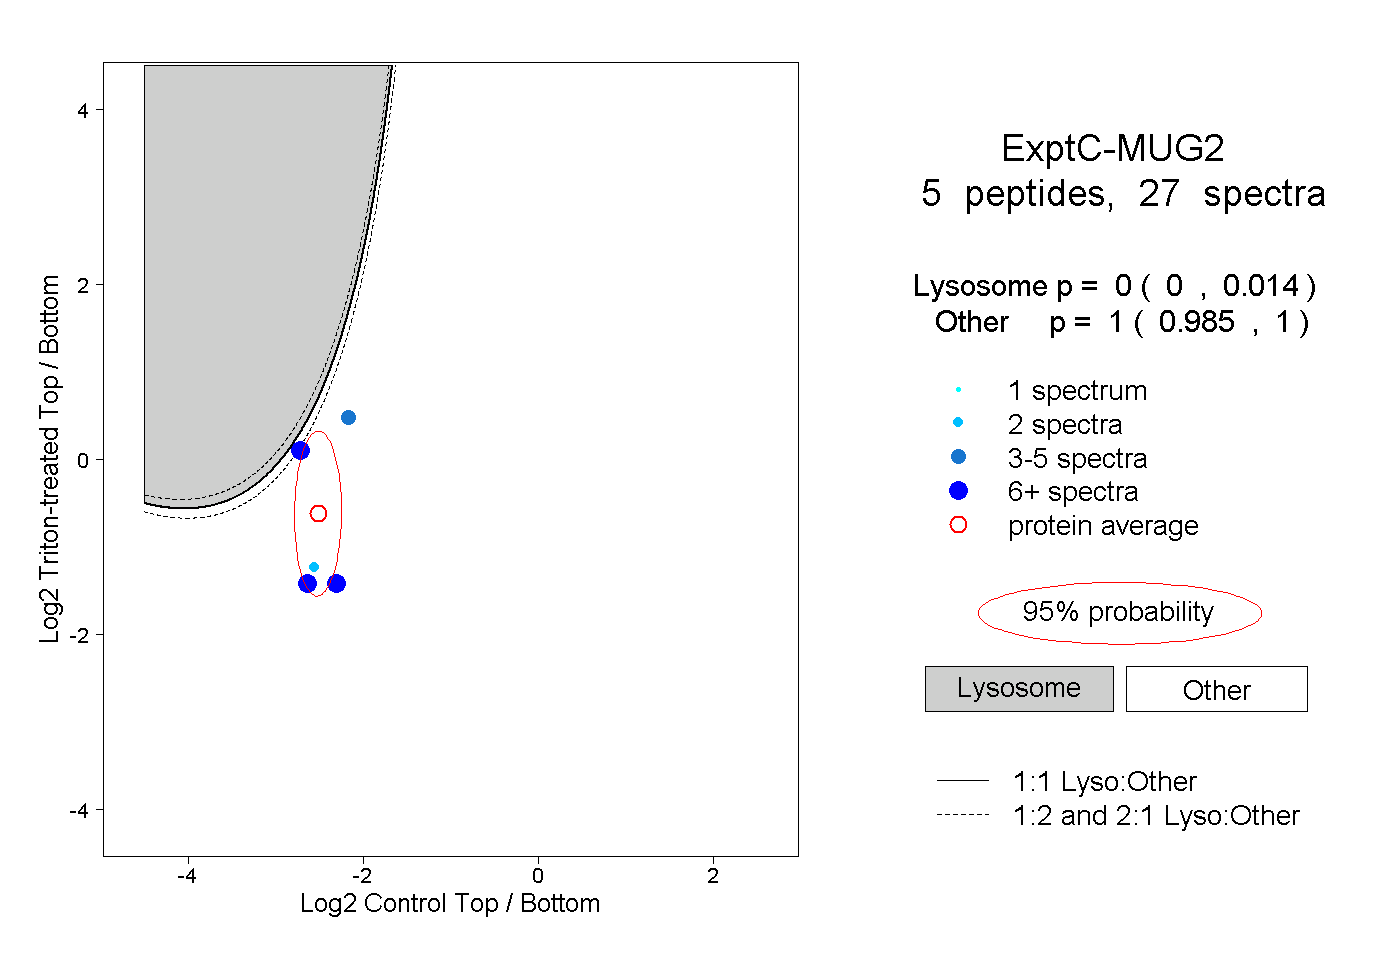
0.000 | 0.014
0.985 | 1.000
1peptide
spectra
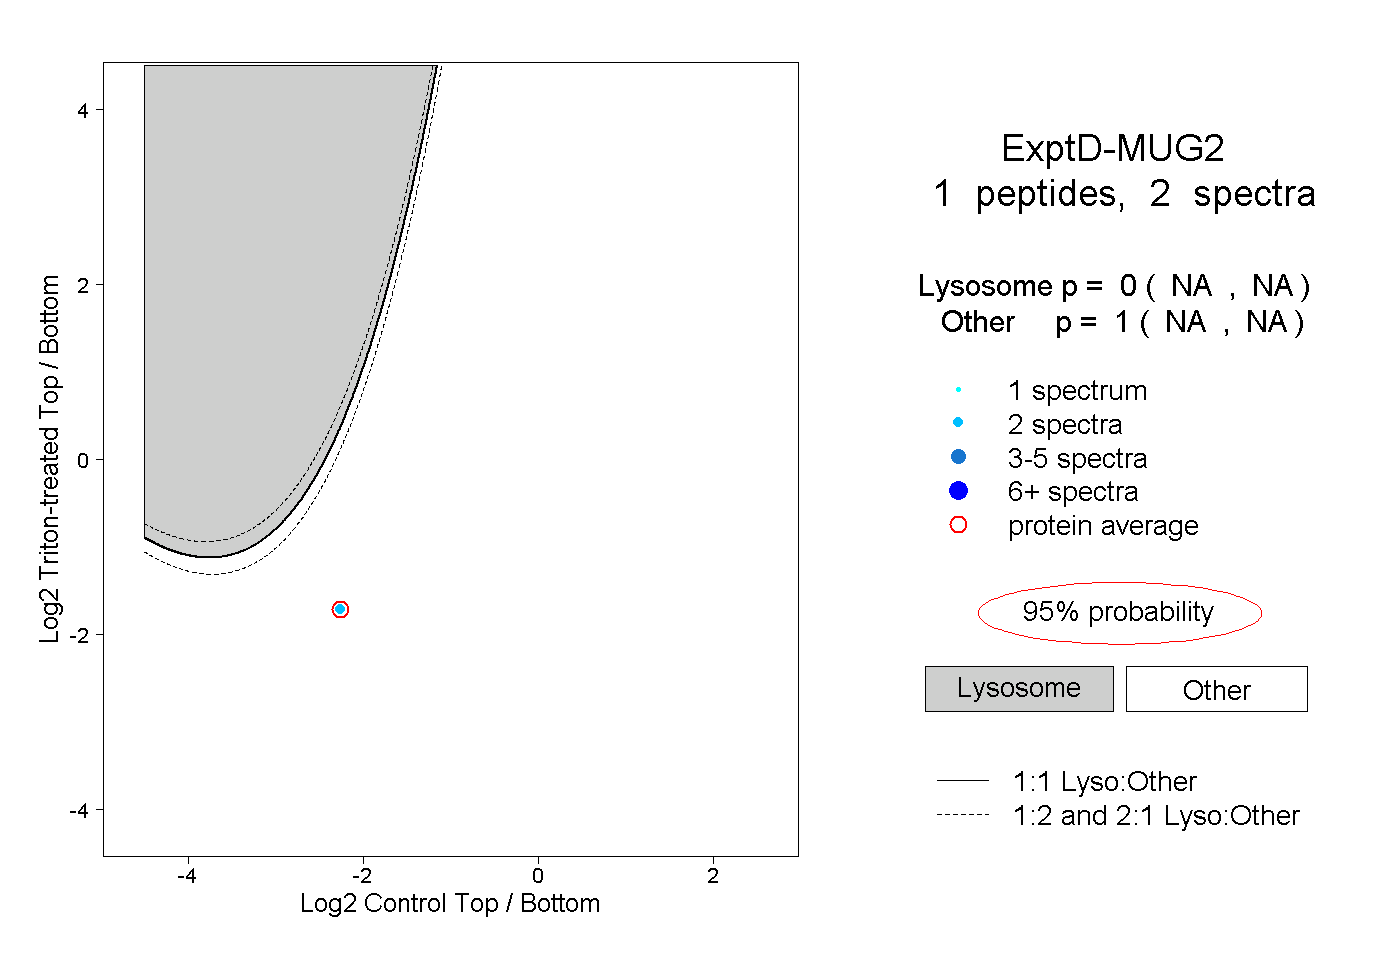
NA | NA
NA | NA