 5
5peptides
spectra
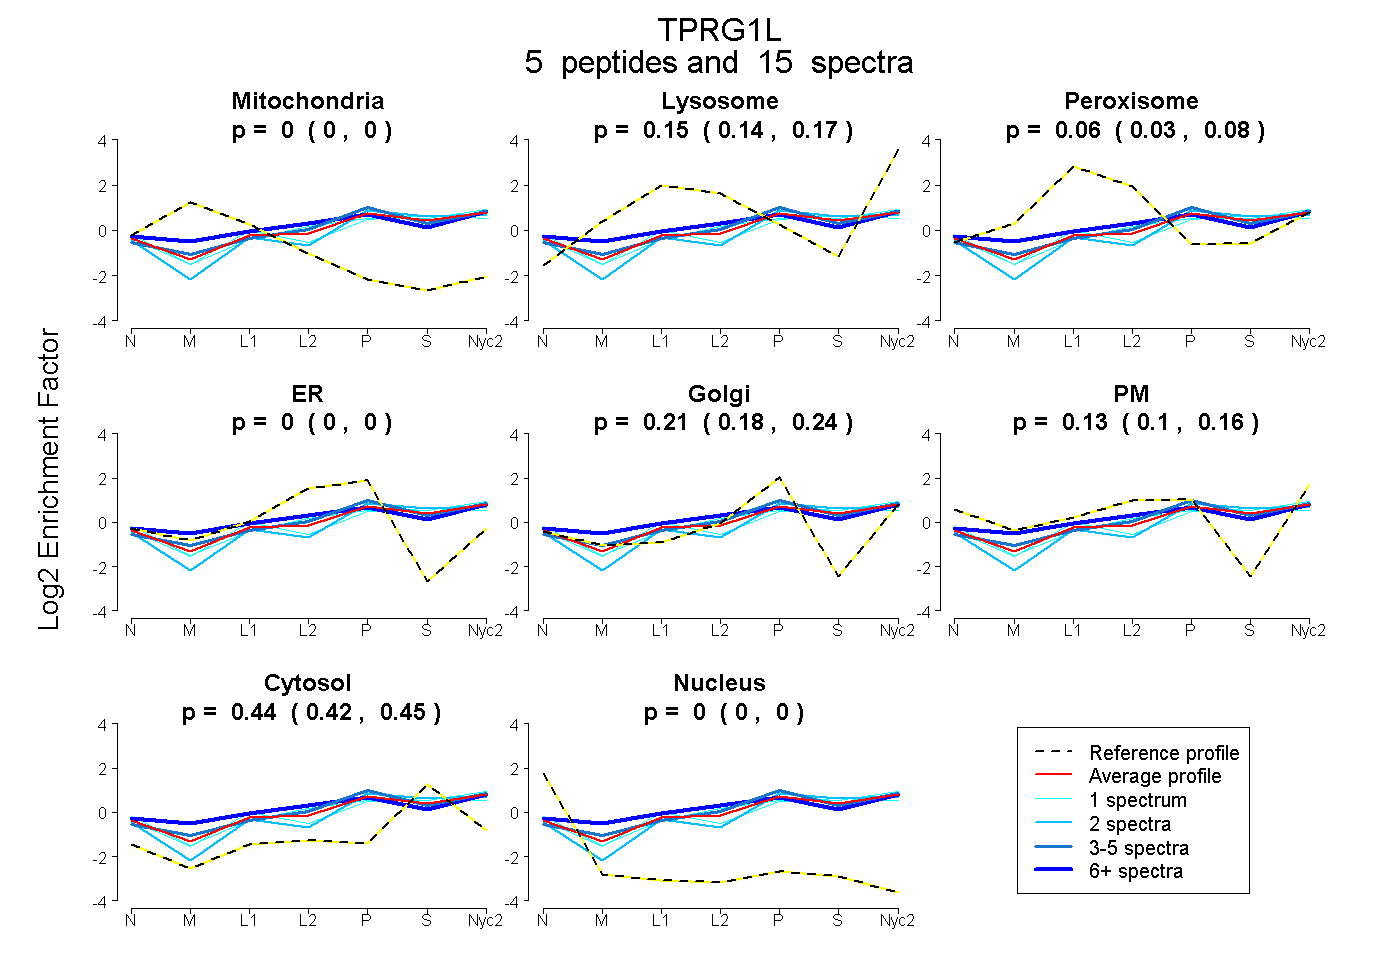
0.000 | 0.000
0.138 | 0.166
0.035 | 0.078
0.000 | 0.000
0.184 | 0.240
0.102 | 0.164
0.423 | 0.452
0.000 | 0.000
1peptide
spectrum
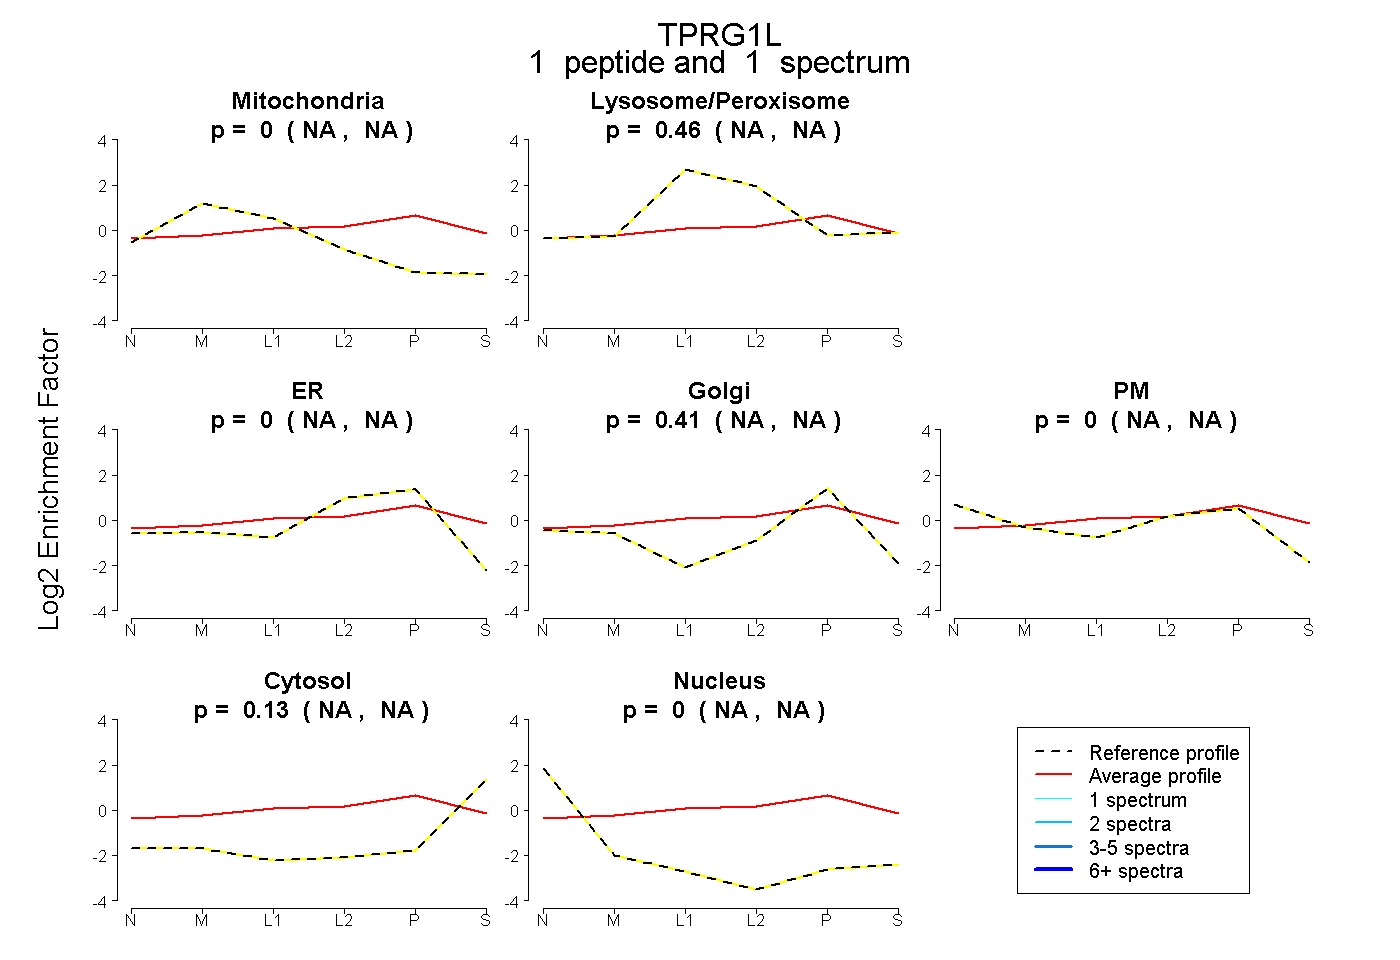
NA | NA
NA | NA
NA | NA
NA | NA
NA | NA
NA | NA
NA | NA
4peptides
spectra
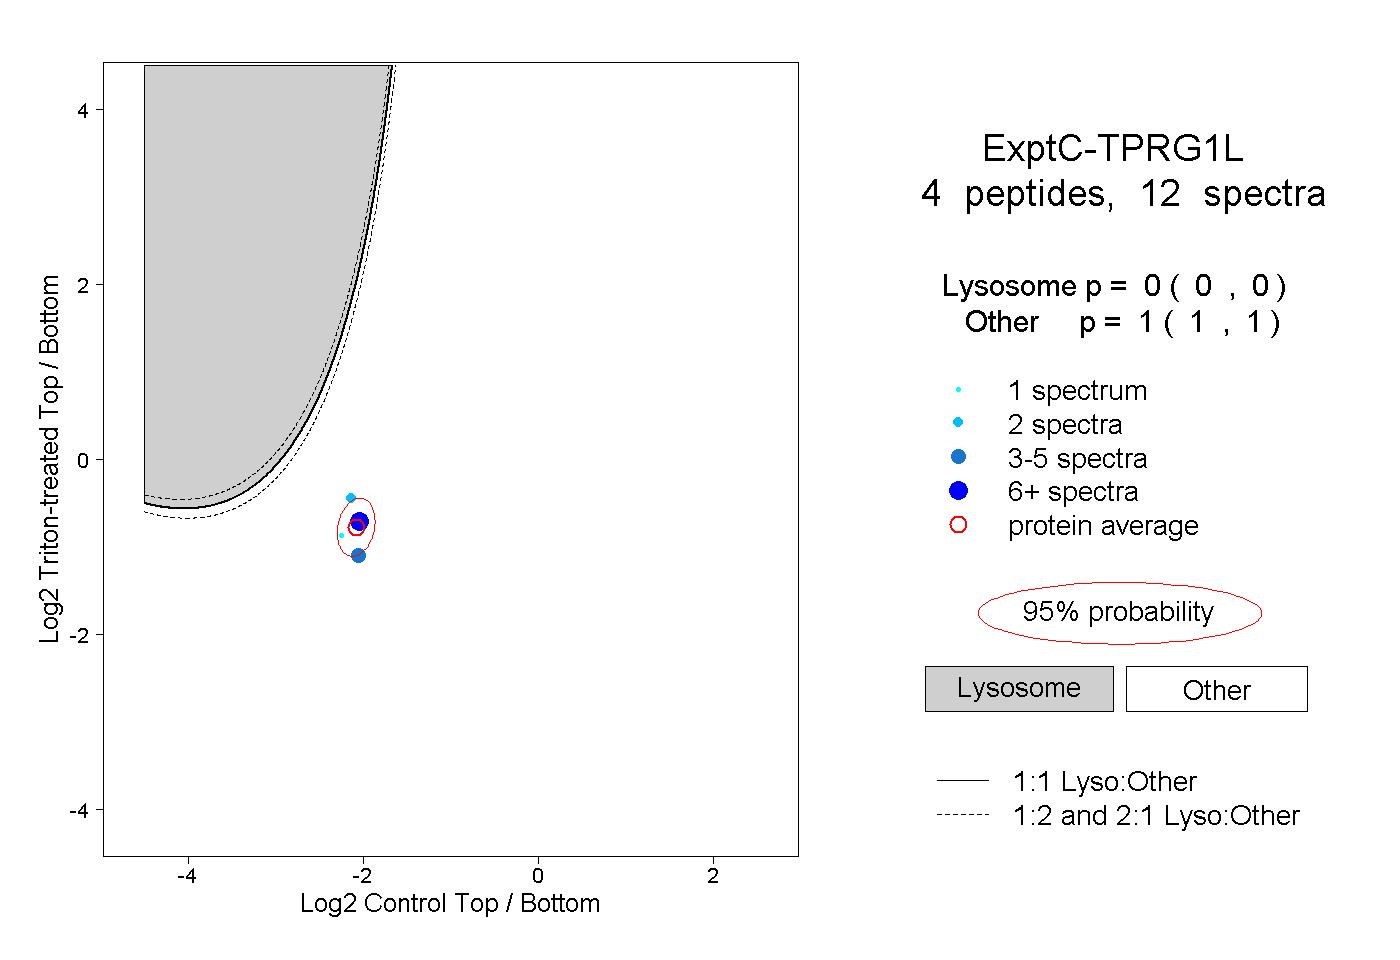
0.000 | 0.000
1.000 | 1.000