 2
2peptides
spectra

0.000 | 0.000
0.006 | 0.134
0.000 | 0.095
0.469 | 0.751
0.000 | 0.324
0.000 | 0.109
0.000 | 0.142
0.000 | 0.000
1peptide
spectrum
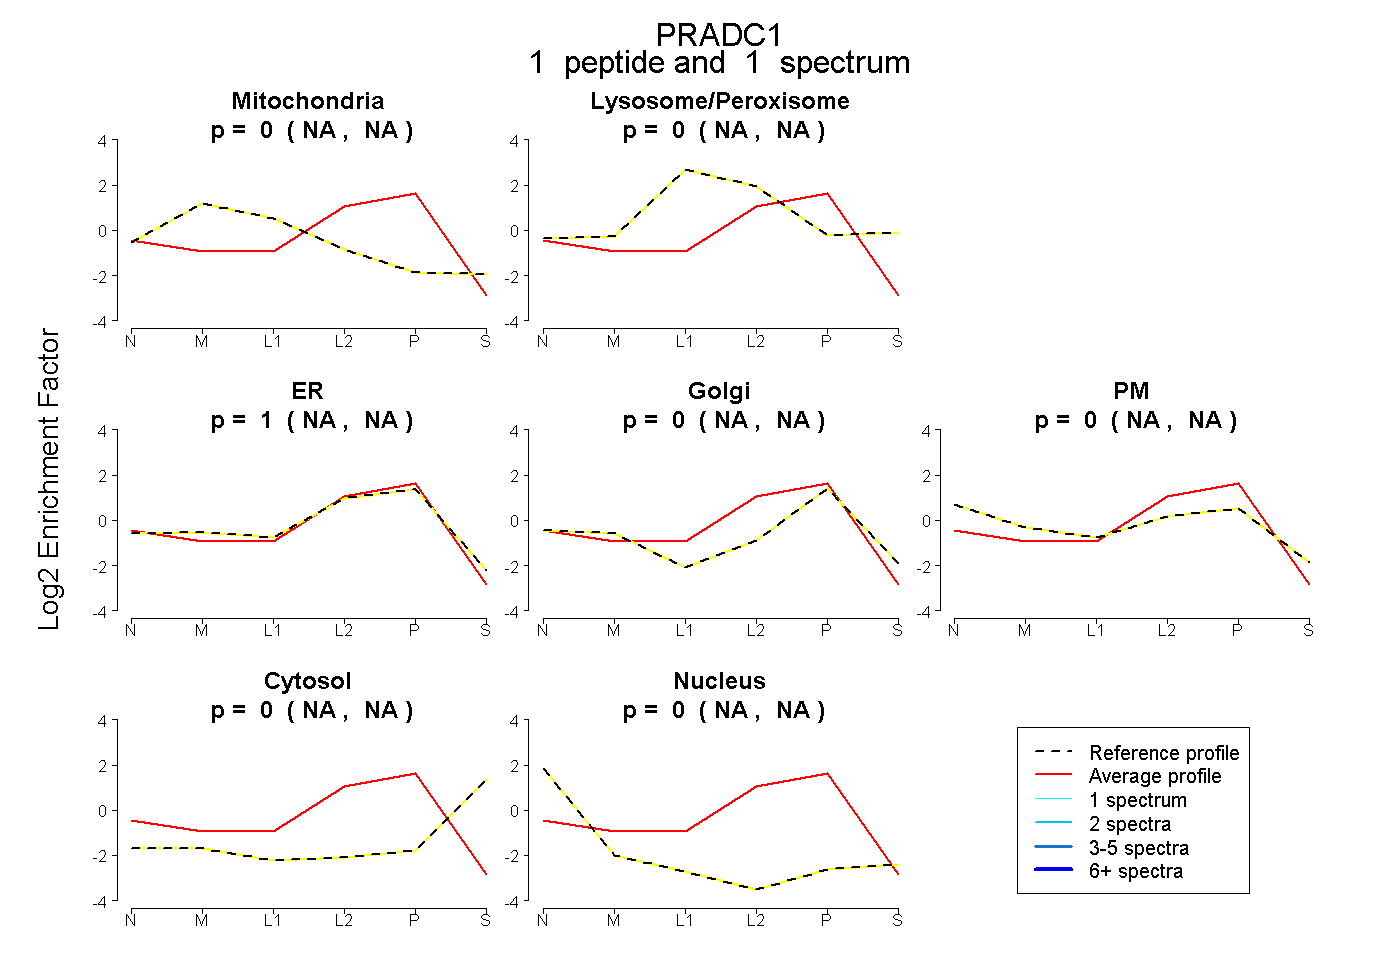
NA | NA
NA | NA
NA | NA
NA | NA
NA | NA
NA | NA
NA | NA
2peptides
spectra
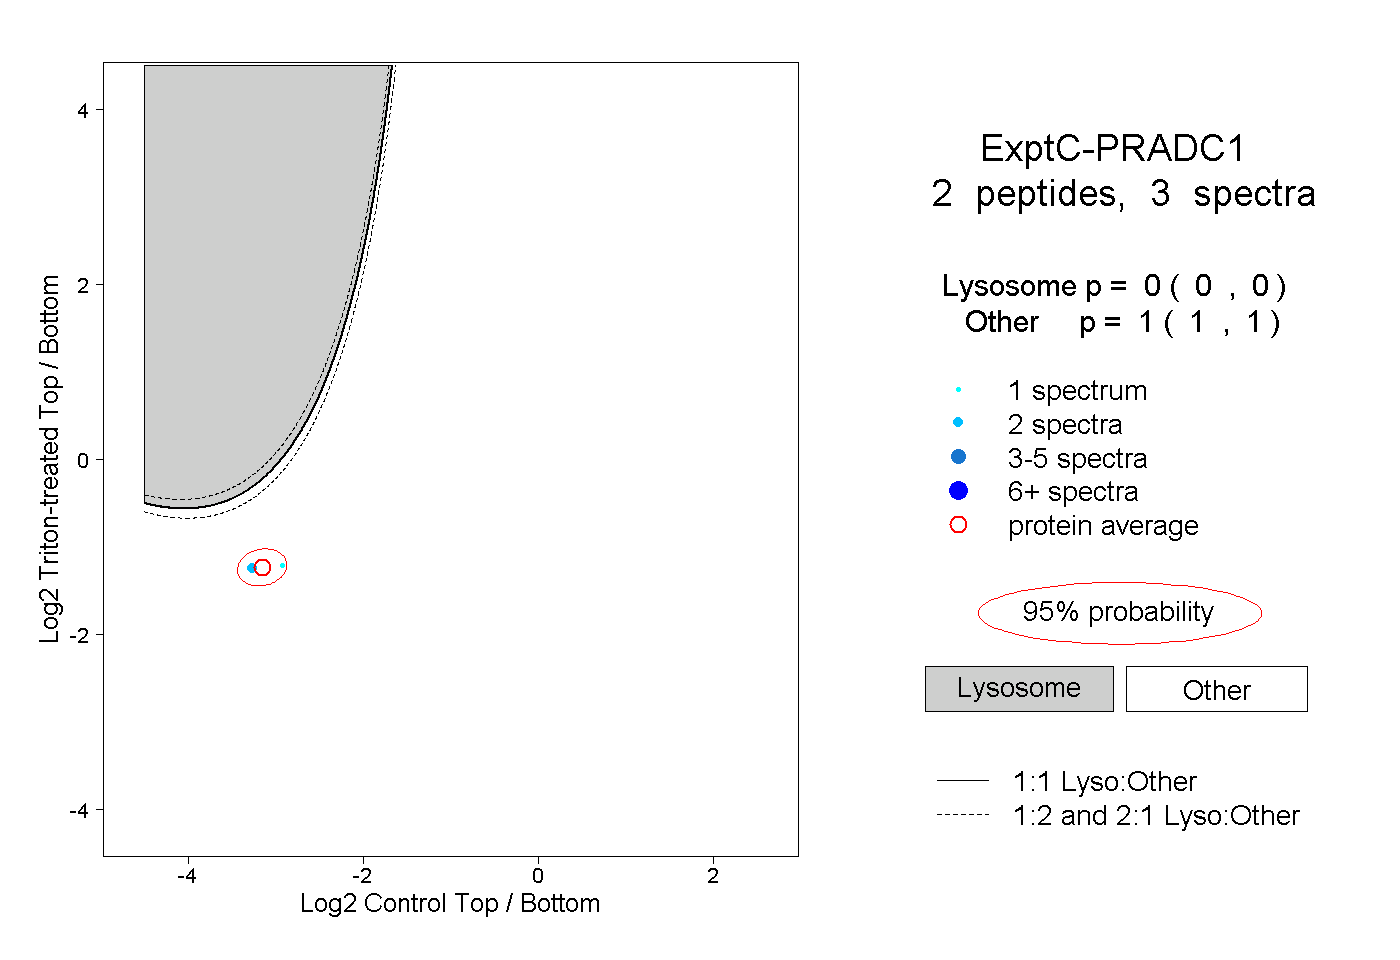
0.000 | 0.000
1.000 | 1.000