 8
8peptides
spectra
0.000 | 0.000
0.000 | 0.000
0.000 | 0.000
0.000 | 0.000
0.000 | 0.000
0.493 | 0.512
0.462 | 0.472
0.018 | 0.038
| Plot | Mito | Lyso | Perox | ER | Golgi | PM | Cytosol | Nucleus | |||||
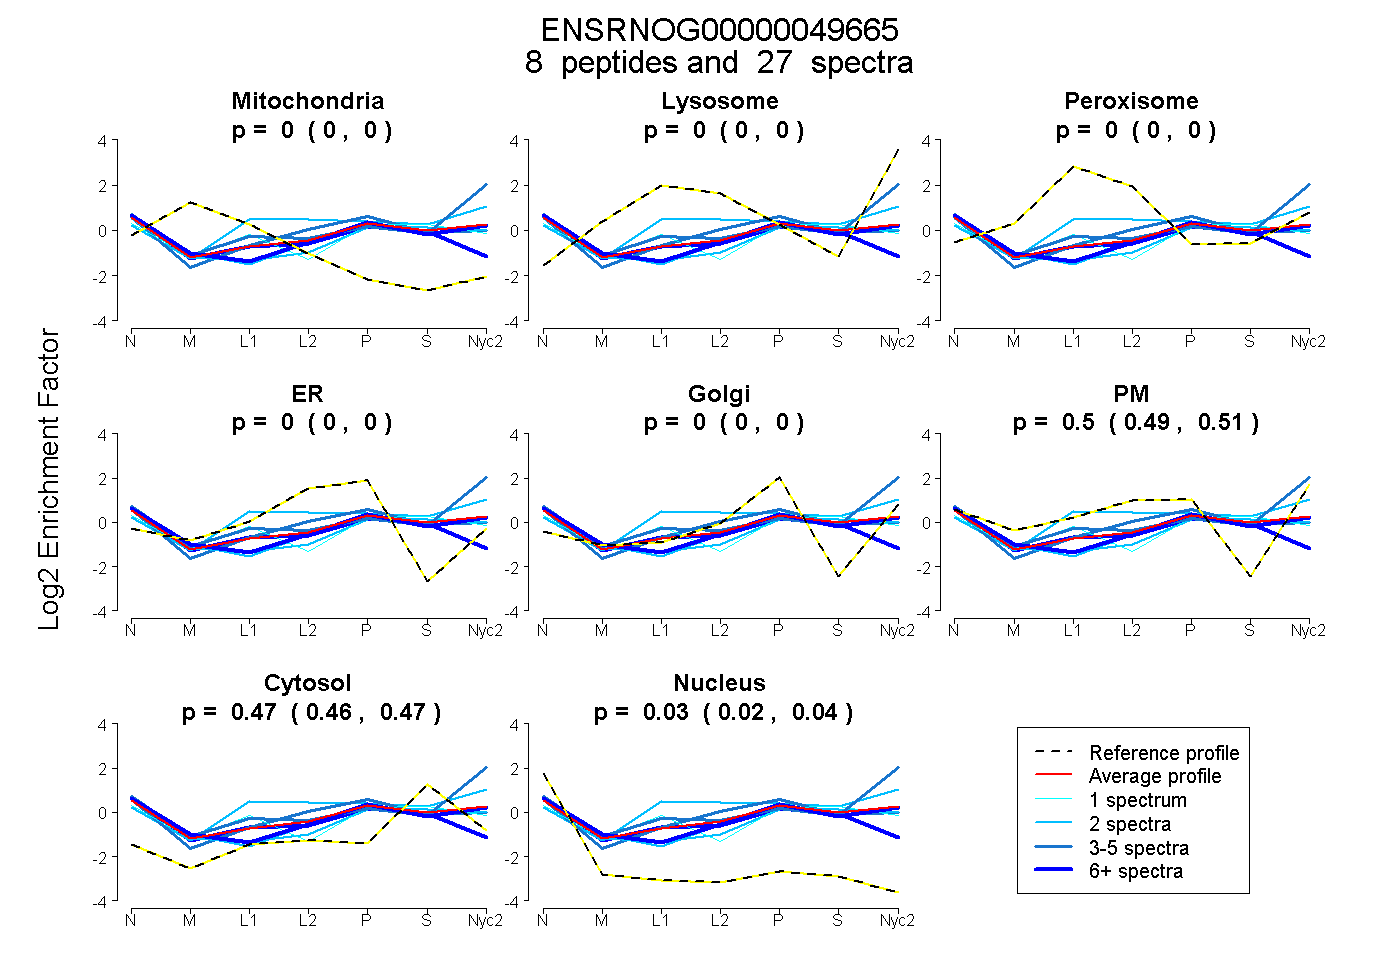
| Expt A |
8 peptides |
27 spectra |
|
0.000 0.000 | 0.000 |
0.000 0.000 | 0.000 |
0.000 0.000 | 0.000 |
0.000 0.000 | 0.000 |
0.000 0.000 | 0.000 |
0.503 0.493 | 0.512 |
0.468 0.462 | 0.472 |
0.029 0.018 | 0.038 |
| 2 spectra, LDVVSYEEVVR | 0.000 | 0.000 | 0.000 | 0.000 | 0.085 | 0.336 | 0.492 | 0.087 | ||
| 1 spectrum, SAEPMGITLK | 0.000 | 0.000 | 0.118 | 0.000 | 0.133 | 0.208 | 0.482 | 0.059 | ||
| 6 spectra, AASCTVAR | 0.000 | 0.000 | 0.106 | 0.232 | 0.000 | 0.098 | 0.391 | 0.173 | ||
| 2 spectra, HSAIFDR | 0.000 | 0.058 | 0.214 | 0.000 | 0.000 | 0.377 | 0.352 | 0.000 | ||
| 4 spectra, SVDQLQR | 0.000 | 0.112 | 0.000 | 0.000 | 0.000 | 0.534 | 0.353 | 0.000 | ||
| 4 spectra, ILHGGAAHR | 0.000 | 0.000 | 0.000 | 0.142 | 0.000 | 0.388 | 0.448 | 0.022 | ||
| 6 spectra, TLVLIGASGVGR | 0.000 | 0.000 | 0.000 | 0.000 | 0.091 | 0.422 | 0.413 | 0.074 | ||
| 2 spectra, NALLAQNPER | 0.000 | 0.000 | 0.000 | 0.000 | 0.129 | 0.385 | 0.402 | 0.085 |
| Plot | Mito | Lyso or Perox | ER | Golgi | PM | Cytosol | Nucleus | ||||||
| Expt B |
6 peptides |
9 spectra |
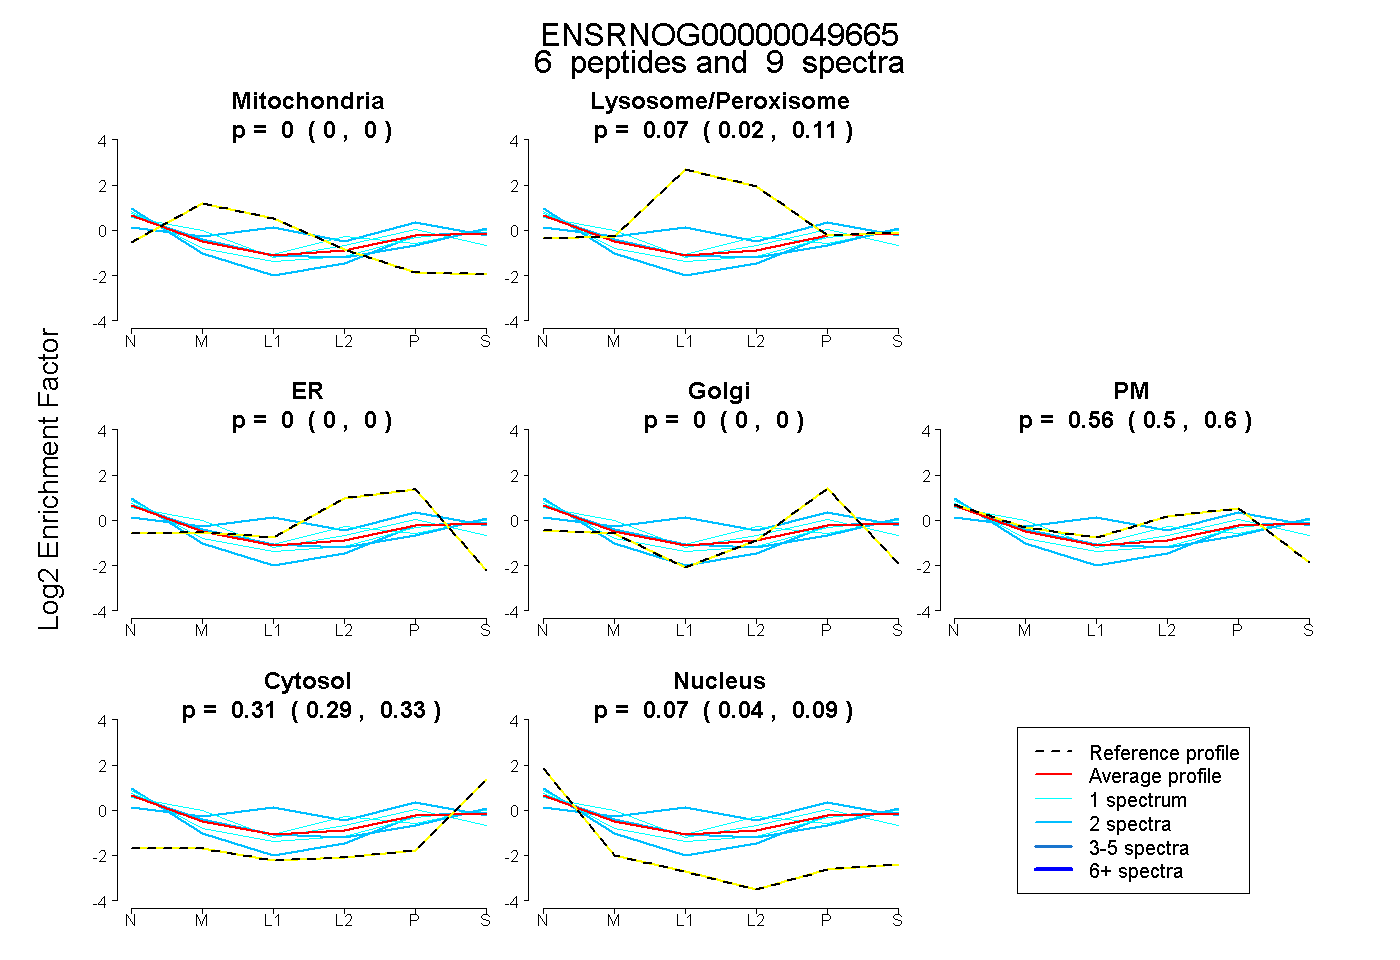 |
0.000 0.000 | 0.000 |
0.065 0.017 | 0.108 |
0.000 0.000 | 0.000 |
0.000 0.000 | 0.000 |
0.557 0.501 | 0.604 |
0.310 0.285 | 0.331 |
0.068 0.036 | 0.093 |
|||
| Plot | Lyso | Other | |||||||||||
| Expt C |
5 peptides |
11 spectra |
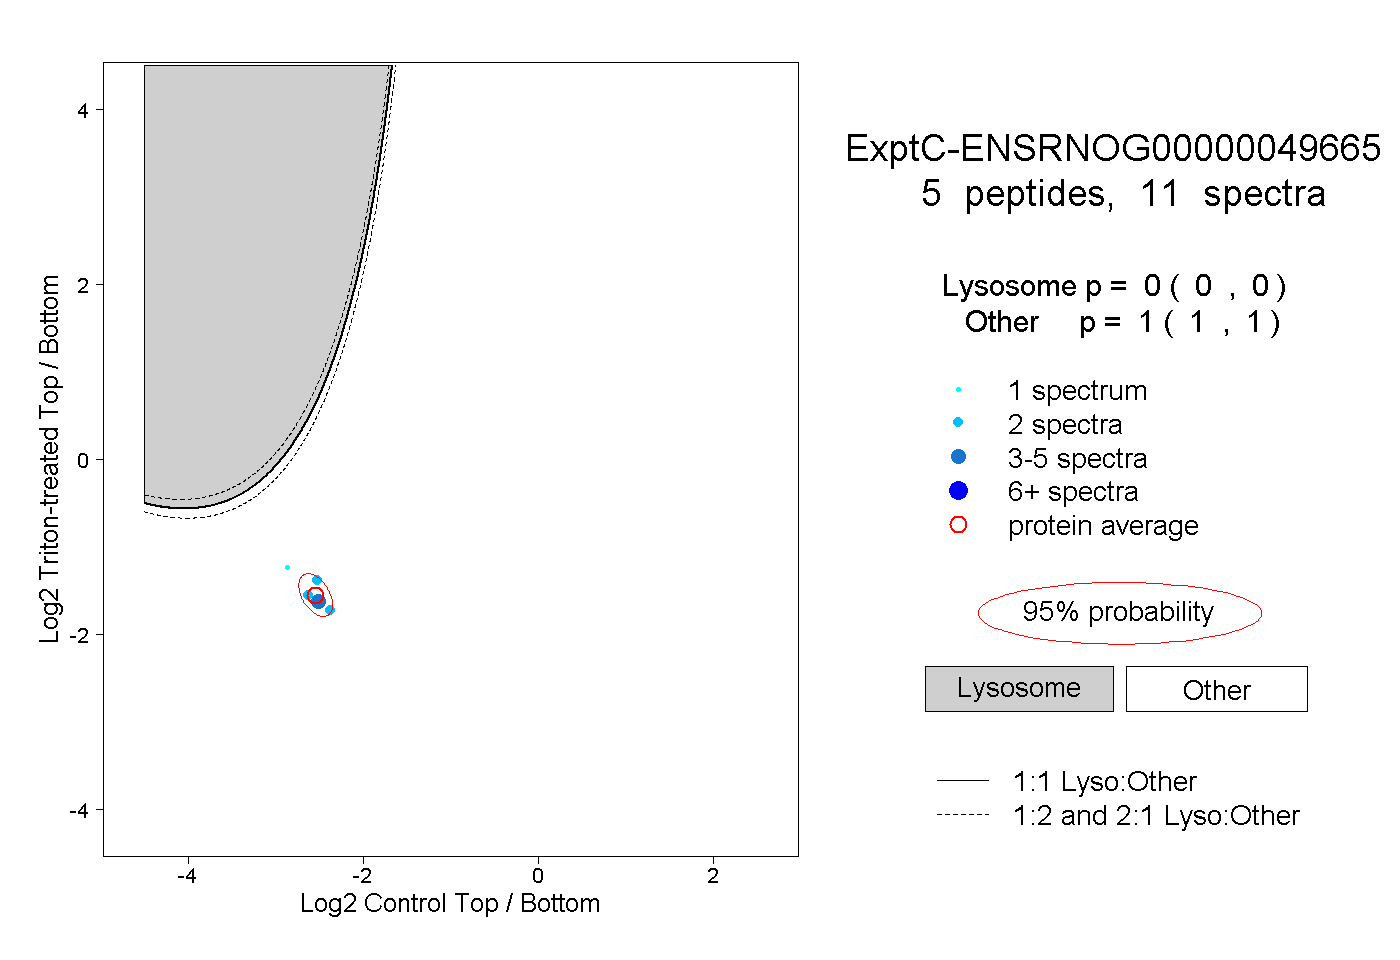 |
0.000 0.000 | 0.000 |
1.000 1.000 | 1.000 |
||||||||
| Plot | Lyso | Other | |||||||||||
| Expt D |
2 peptides |
3 spectra |
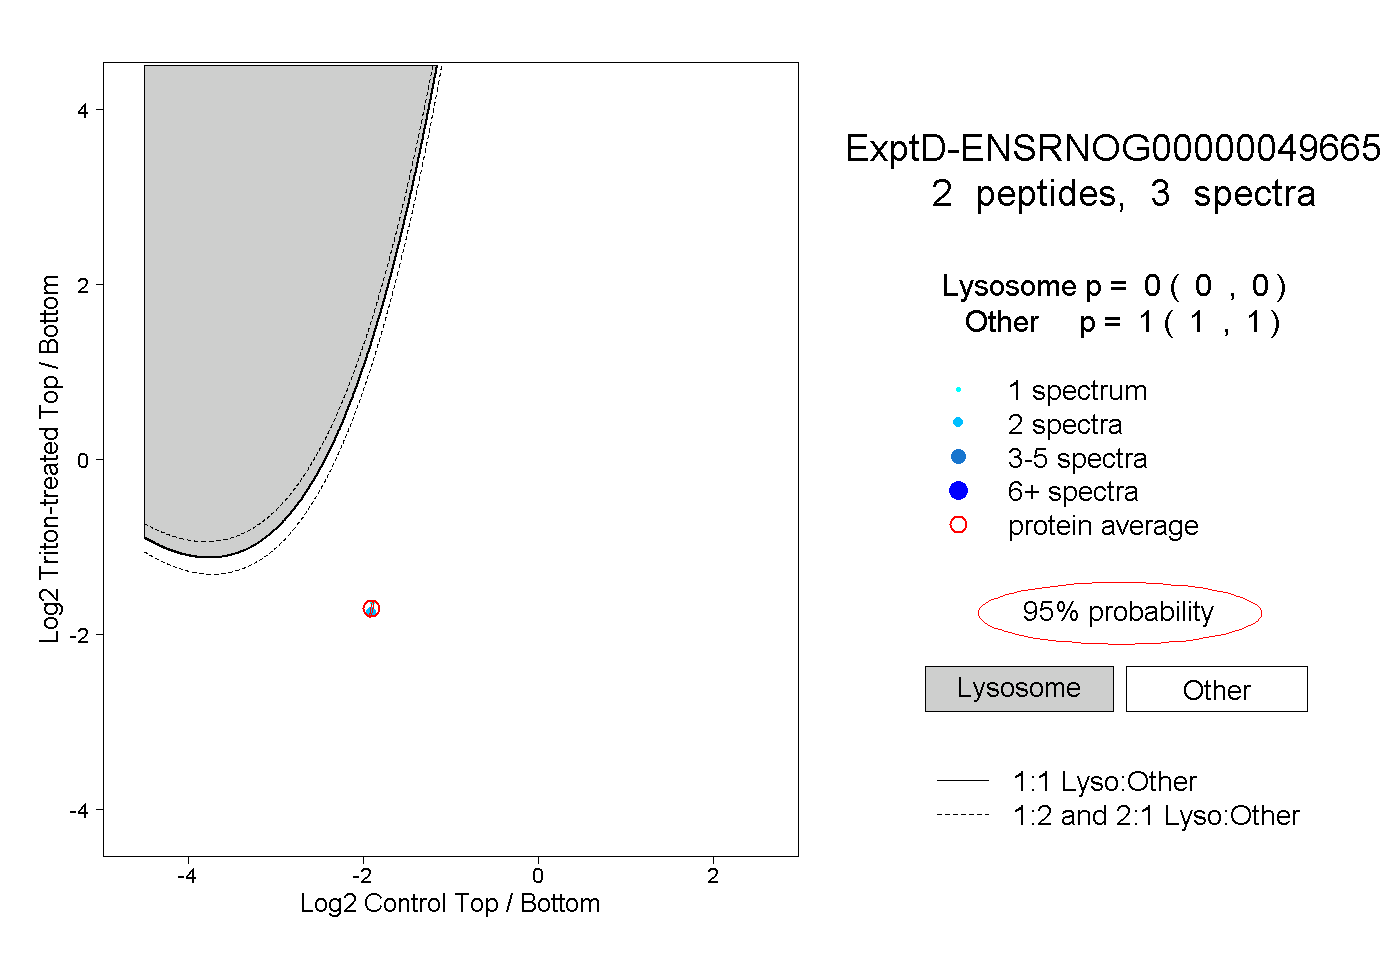 |
0.000 0.000 | 0.000 |
1.000 1.000 | 1.000 |