 20
20peptides
spectra
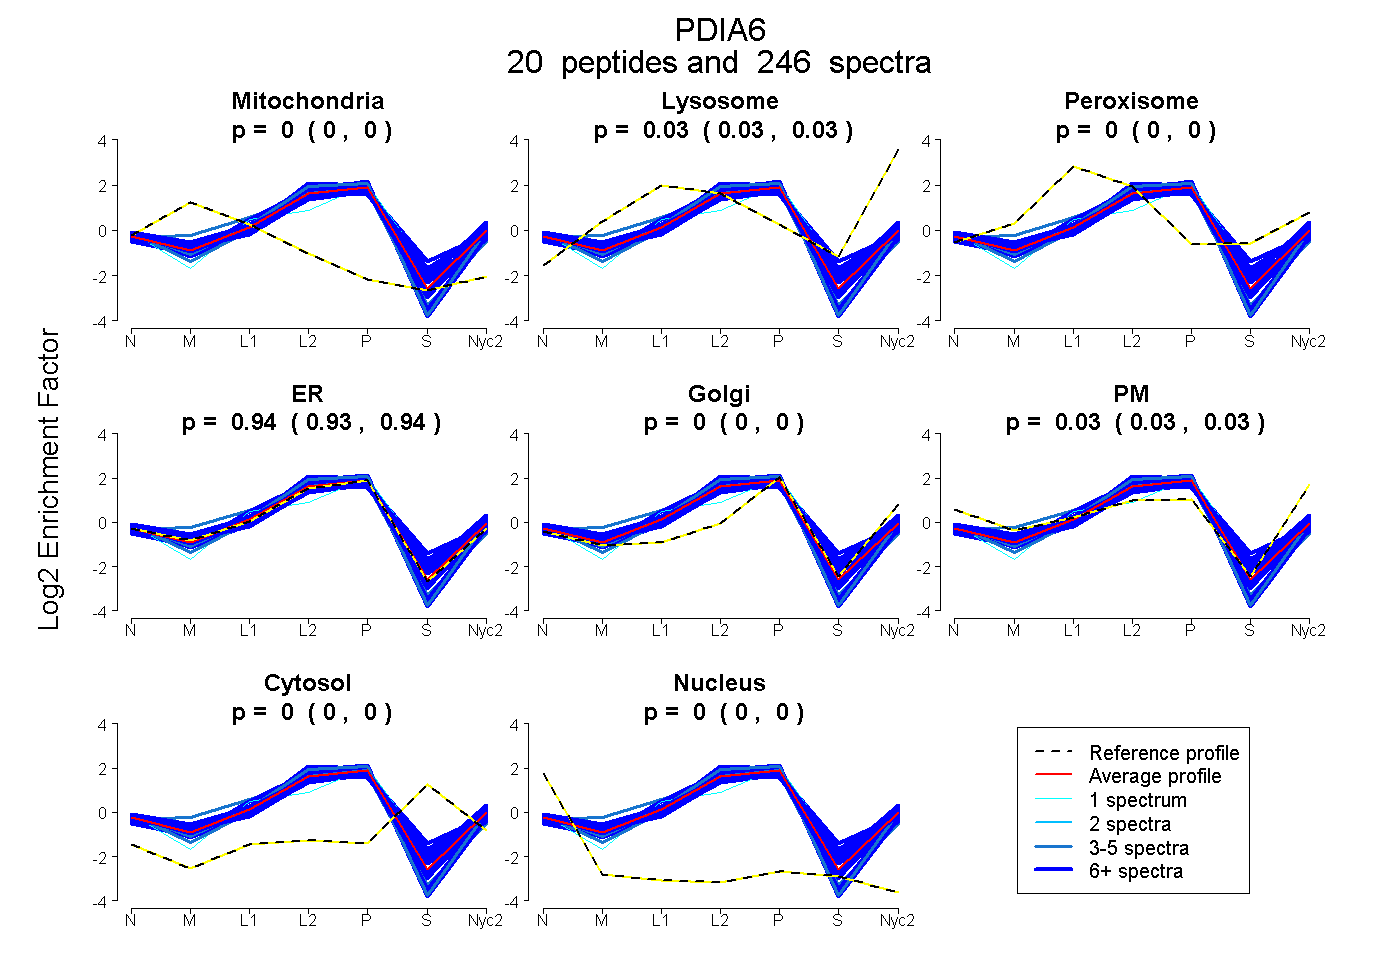
0.000 | 0.000
0.030 | 0.034
0.000 | 0.000
0.934 | 0.938
0.000 | 0.000
0.028 | 0.034
0.000 | 0.000
0.000 | 0.000
18peptides
spectra
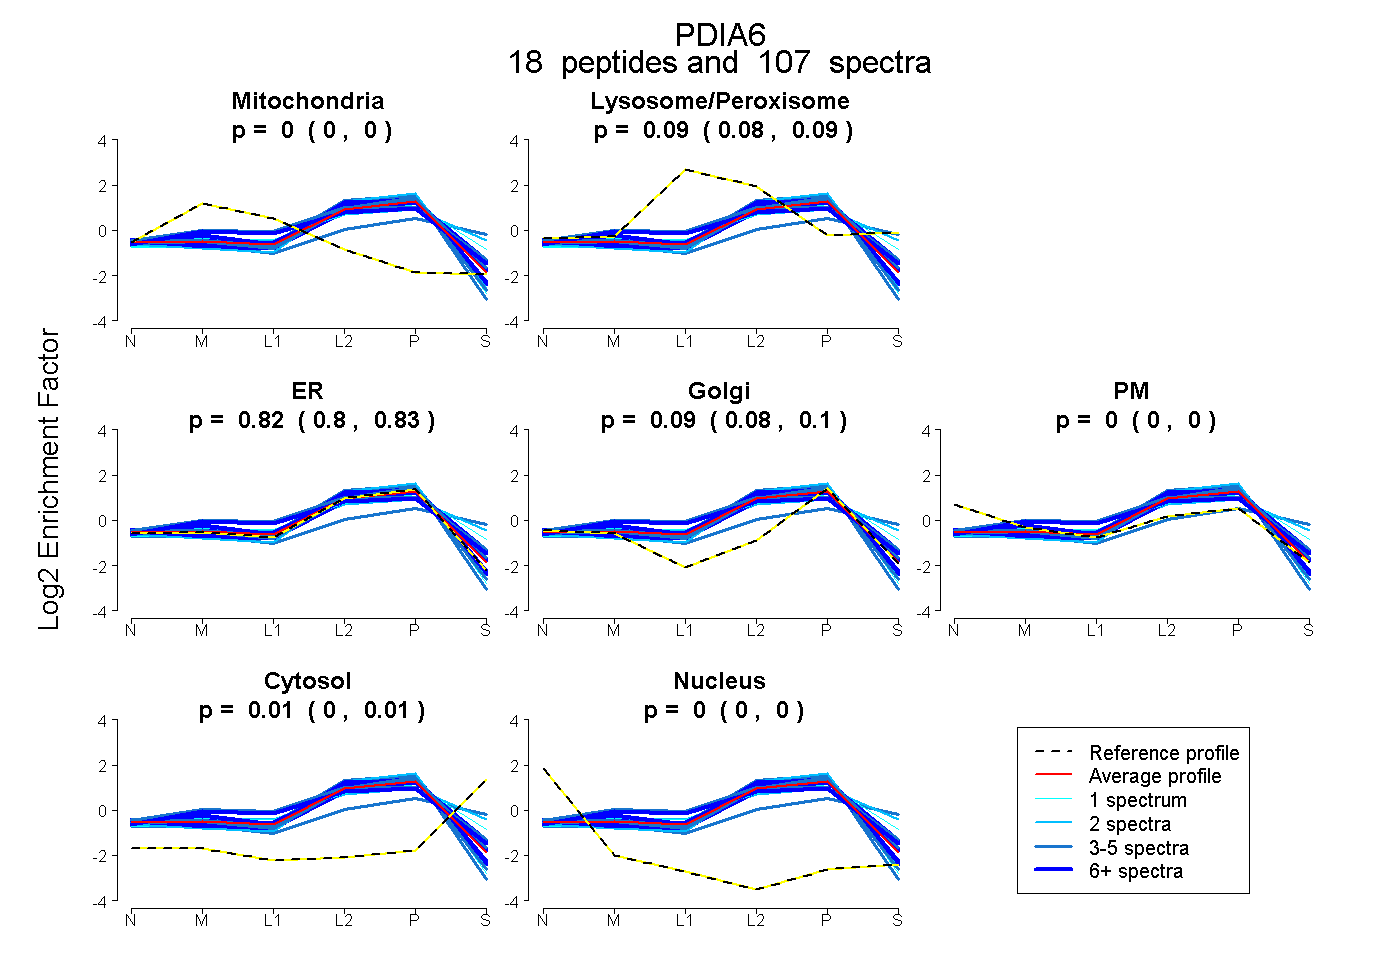
0.000 | 0.000
0.084 | 0.095
0.803 | 0.828
0.076 | 0.096
0.000 | 0.000
0.002 | 0.009
0.000 | 0.000
20peptides
spectra

0.000 | 0.000
1.000 | 1.000
