 4
4peptides
spectra
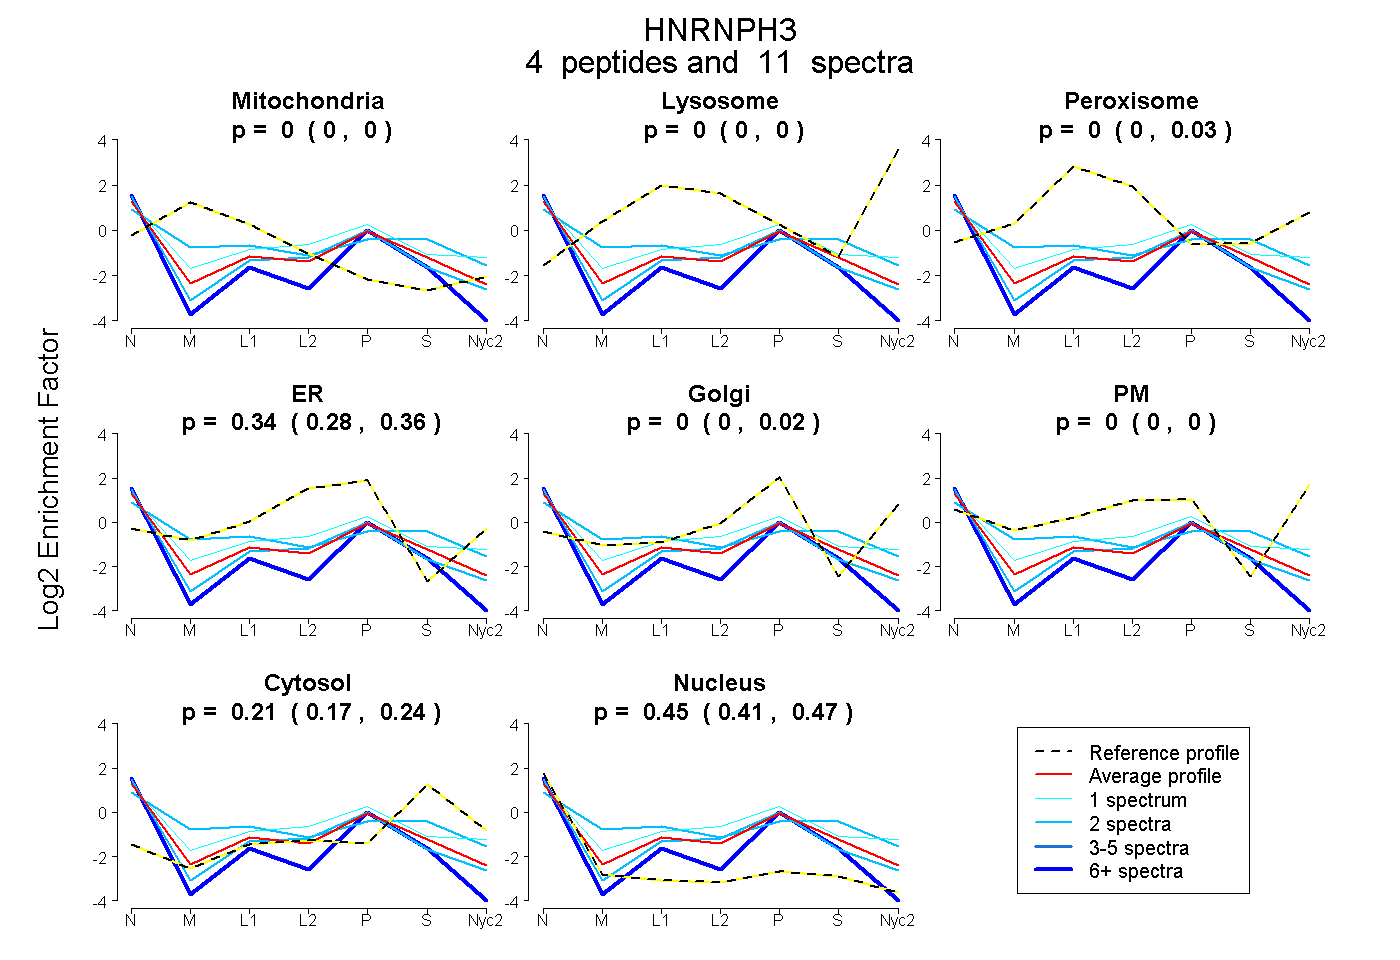
0.000 | 0.000
0.000 | 0.000
0.000 | 0.029
0.280 | 0.362
0.000 | 0.021
0.000 | 0.000
0.165 | 0.242
0.412 | 0.474
3peptides
spectra
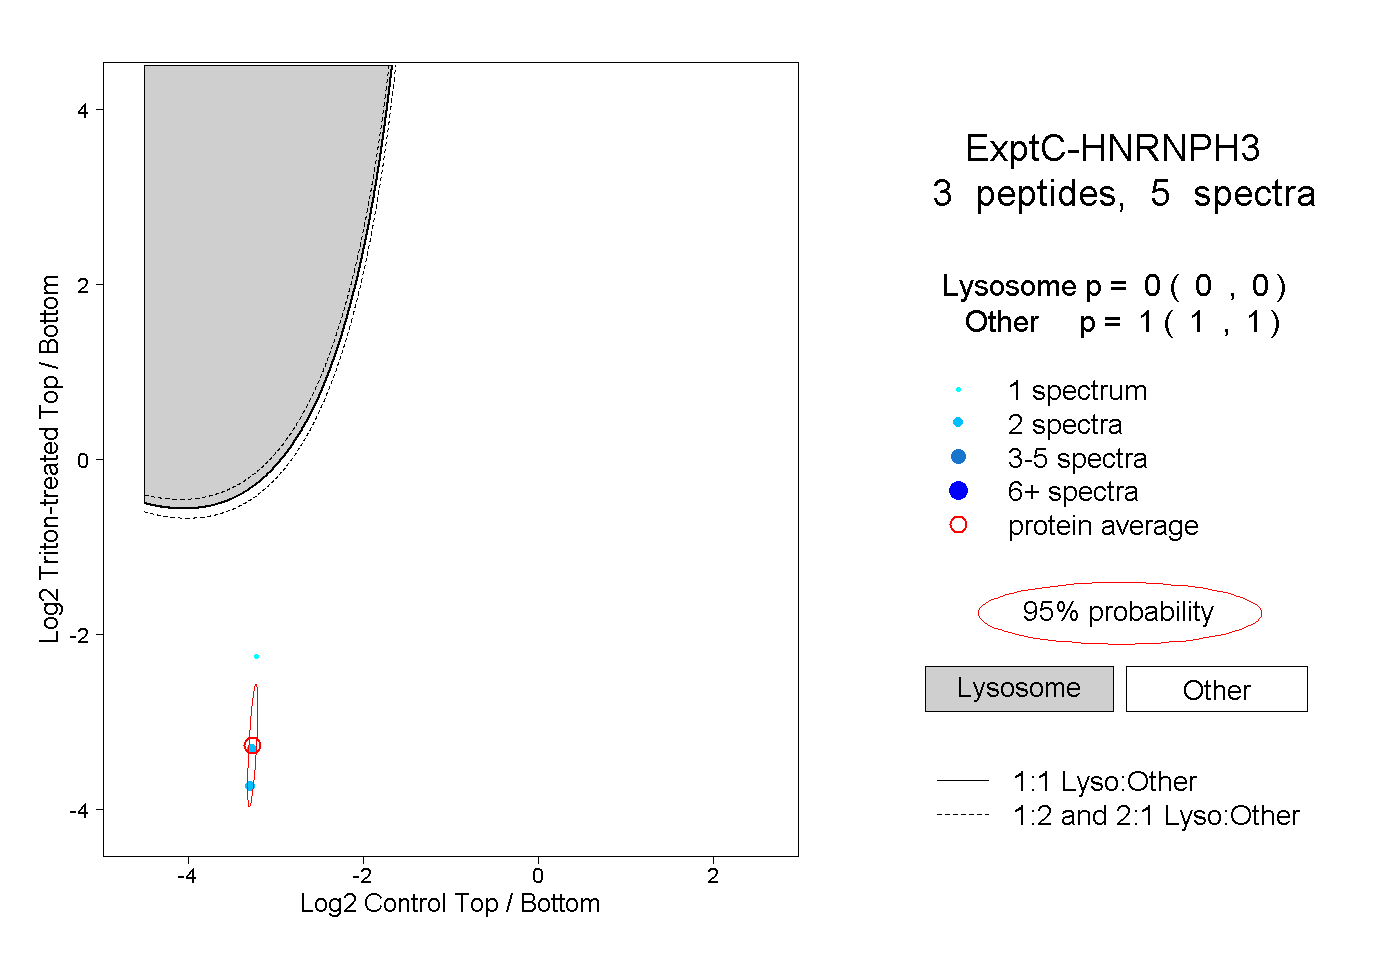
0.000 | 0.000
1.000 | 1.000
1peptide
spectrum
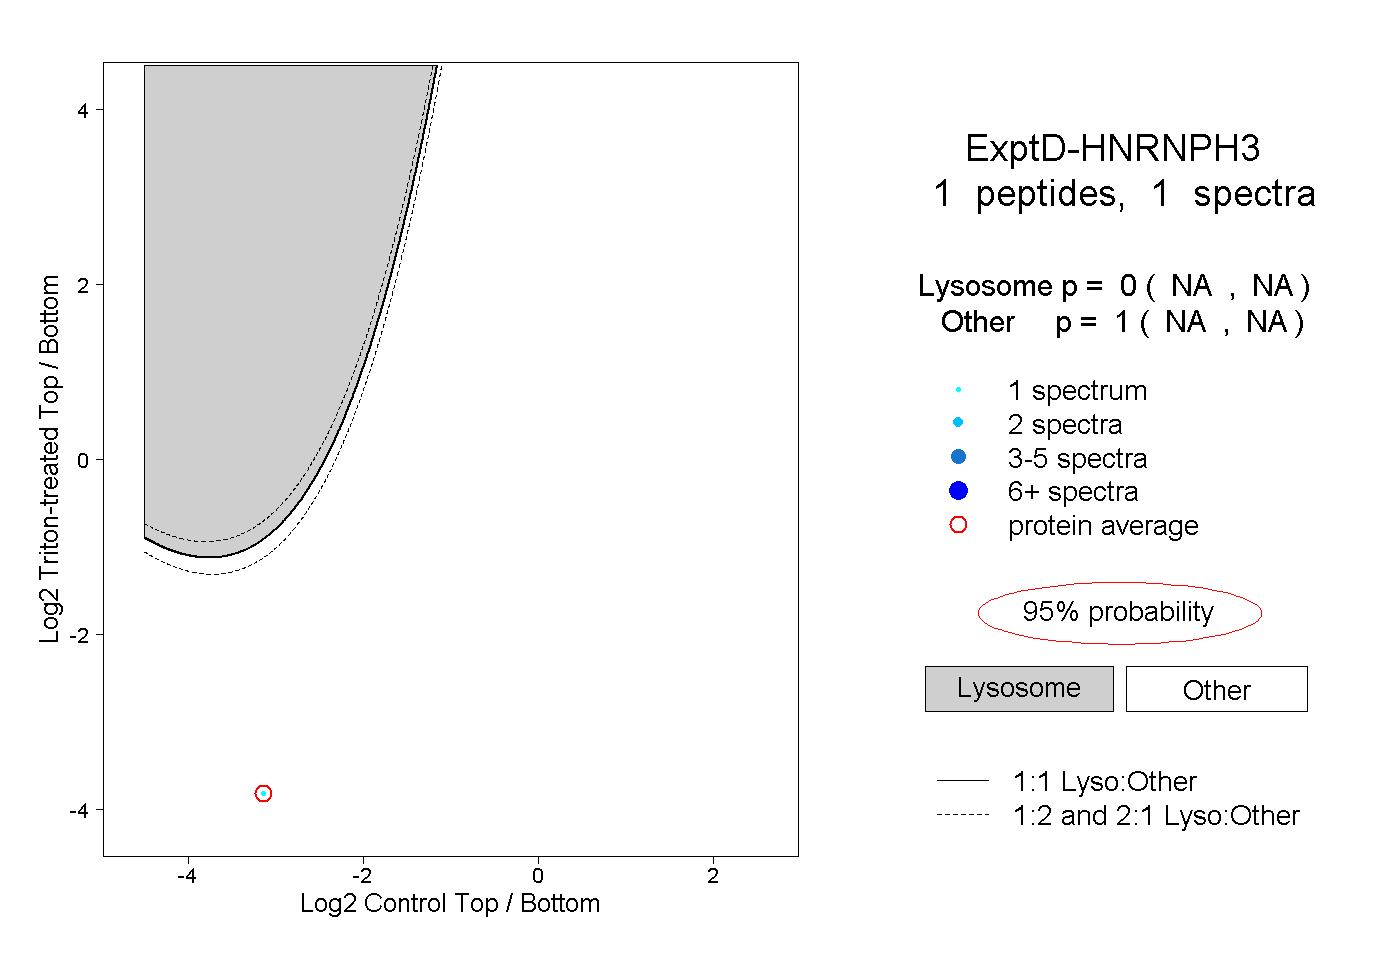
NA | NA
NA | NA