 2
2peptides
spectra
NA | NA
NA | NA
NA | NA
NA | NA
NA | NA
NA | NA
NA | NA
NA | NA
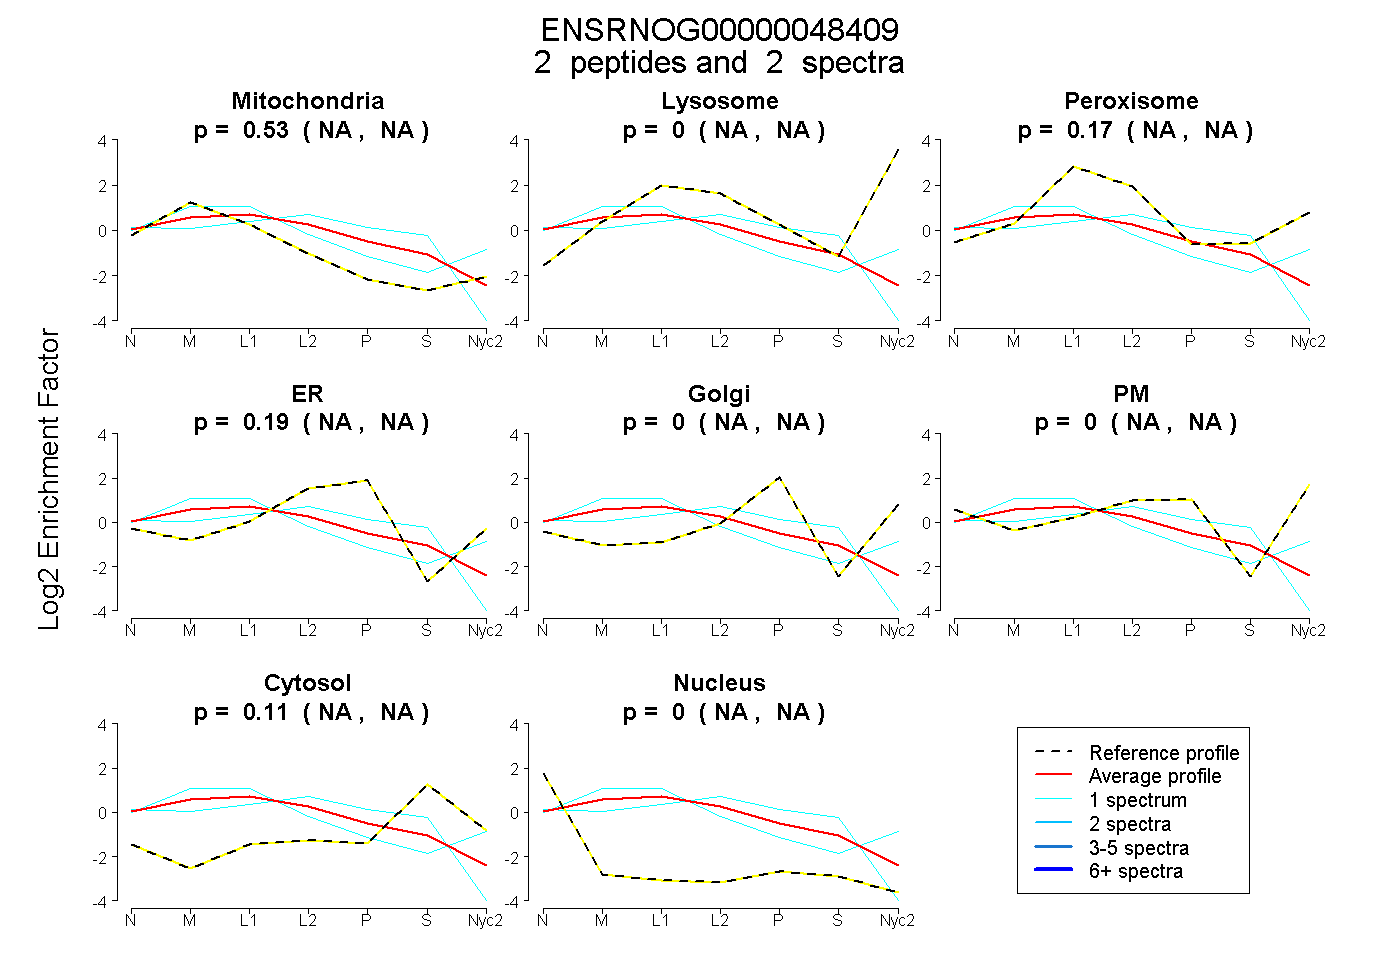
| Plot | Mito | Lyso | Perox | ER | Golgi | PM | Cytosol | Nucleus | |||||
| Expt A |
2 peptides |
2 spectra |
|
0.533 NA | NA |
0.000 NA | NA |
0.167 NA | NA |
0.194 NA | NA |
0.000 NA | NA |
0.000 NA | NA |
0.106 NA | NA |
0.000 NA | NA |
| 1 spectrum, TVMVQEGNVEGAYR | 0.445 | 0.000 | 0.016 | 0.313 | 0.000 | 0.000 | 0.224 | 0.001 | ||
| 1 spectrum, INFLMR | 0.608 | 0.000 | 0.279 | 0.000 | 0.000 | 0.113 | 0.000 | 0.000 |