 5
5peptides
spectra
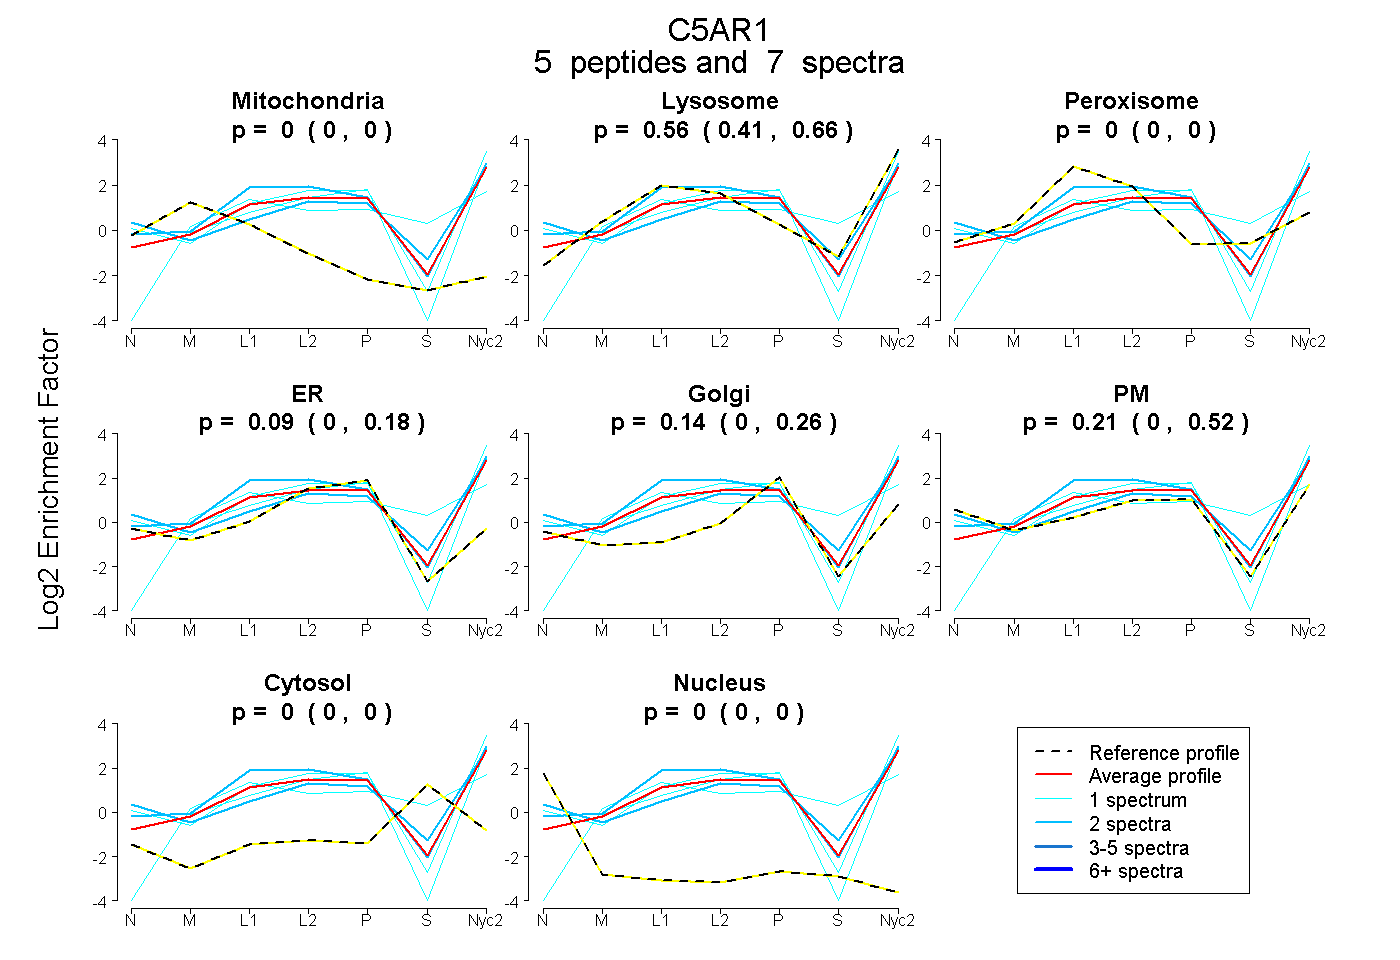
0.000 | 0.000
0.413 | 0.663
0.000 | 0.000
0.000 | 0.177
0.000 | 0.255
0.000 | 0.523
0.000 | 0.000
0.000 | 0.000
| Plot | Mito | Lyso | Perox | ER | Golgi | PM | Cytosol | Nucleus | |||||
| Expt A |
5 peptides |
7 spectra |
|
0.000 0.000 | 0.000 |
0.561 0.413 | 0.663 |
0.000 0.000 | 0.000 |
0.087 0.000 | 0.177 |
0.139 0.000 | 0.255 |
0.213 0.000 | 0.523 |
0.000 0.000 | 0.000 |
0.000 0.000 | 0.000 |
| 2 spectra, NVLSEDSLGR | 0.000 | 0.323 | 0.000 | 0.000 | 0.000 | 0.662 | 0.015 | 0.000 | ||
| 1 spectrum, AIAILR | 0.000 | 0.381 | 0.000 | 0.000 | 0.000 | 0.619 | 0.000 | 0.000 | ||
| 2 spectra, SSSTFQSVER | 0.000 | 0.563 | 0.000 | 0.041 | 0.000 | 0.396 | 0.000 | 0.000 | ||
| 1 spectrum, SLPSILR | 0.000 | 0.190 | 0.000 | 0.000 | 0.000 | 0.810 | 0.000 | 0.000 | ||
| 1 spectrum, DPYSDSILCNIDYSK | 0.000 | 0.730 | 0.000 | 0.000 | 0.000 | 0.000 | 0.270 | 0.000 |
| Plot | Lyso | Other | |||||||||||
| Expt C |
1 peptide |
5 spectra |
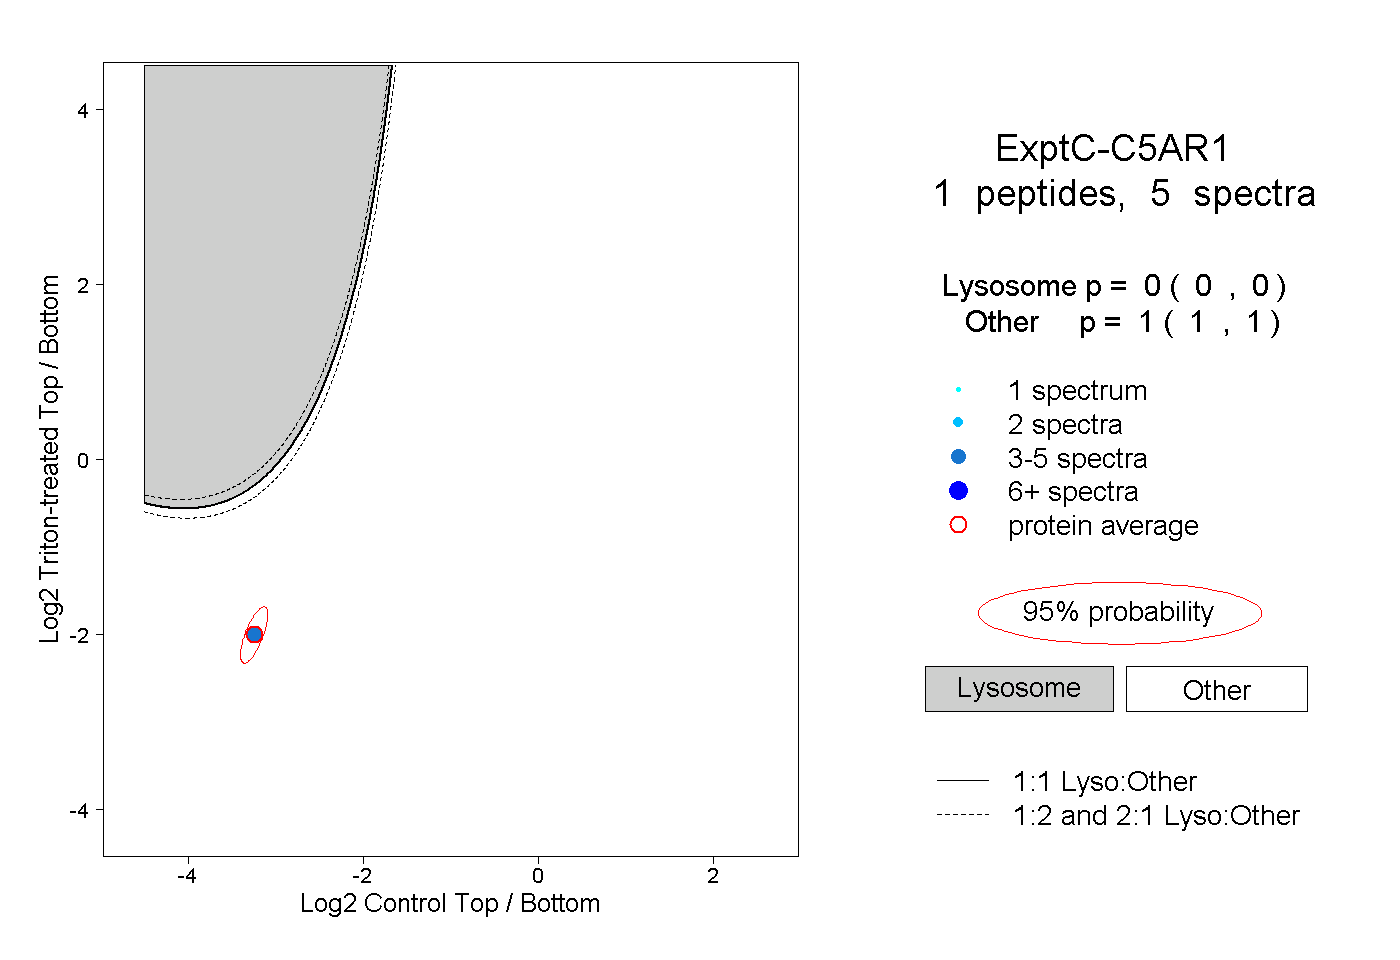 |
0.000 0.000 | 0.000 |
1.000 1.000 | 1.000 |