 2
2peptides
spectra
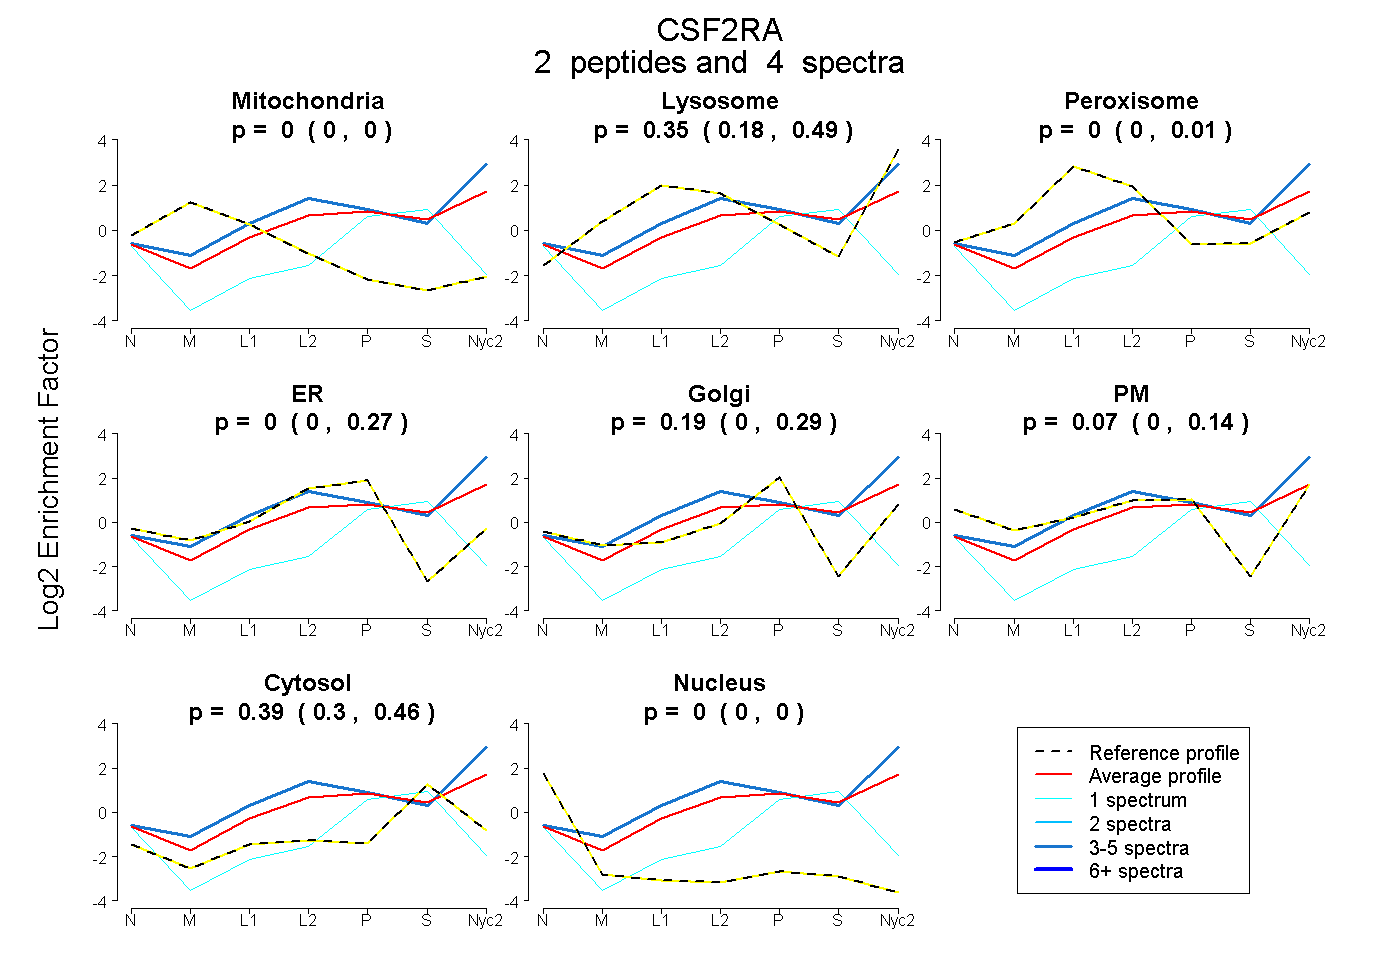
0.000 | 0.000
0.180 | 0.485
0.000 | 0.007
0.000 | 0.266
0.000 | 0.290
0.000 | 0.139
0.304 | 0.457
0.000 | 0.000
3peptides
spectra
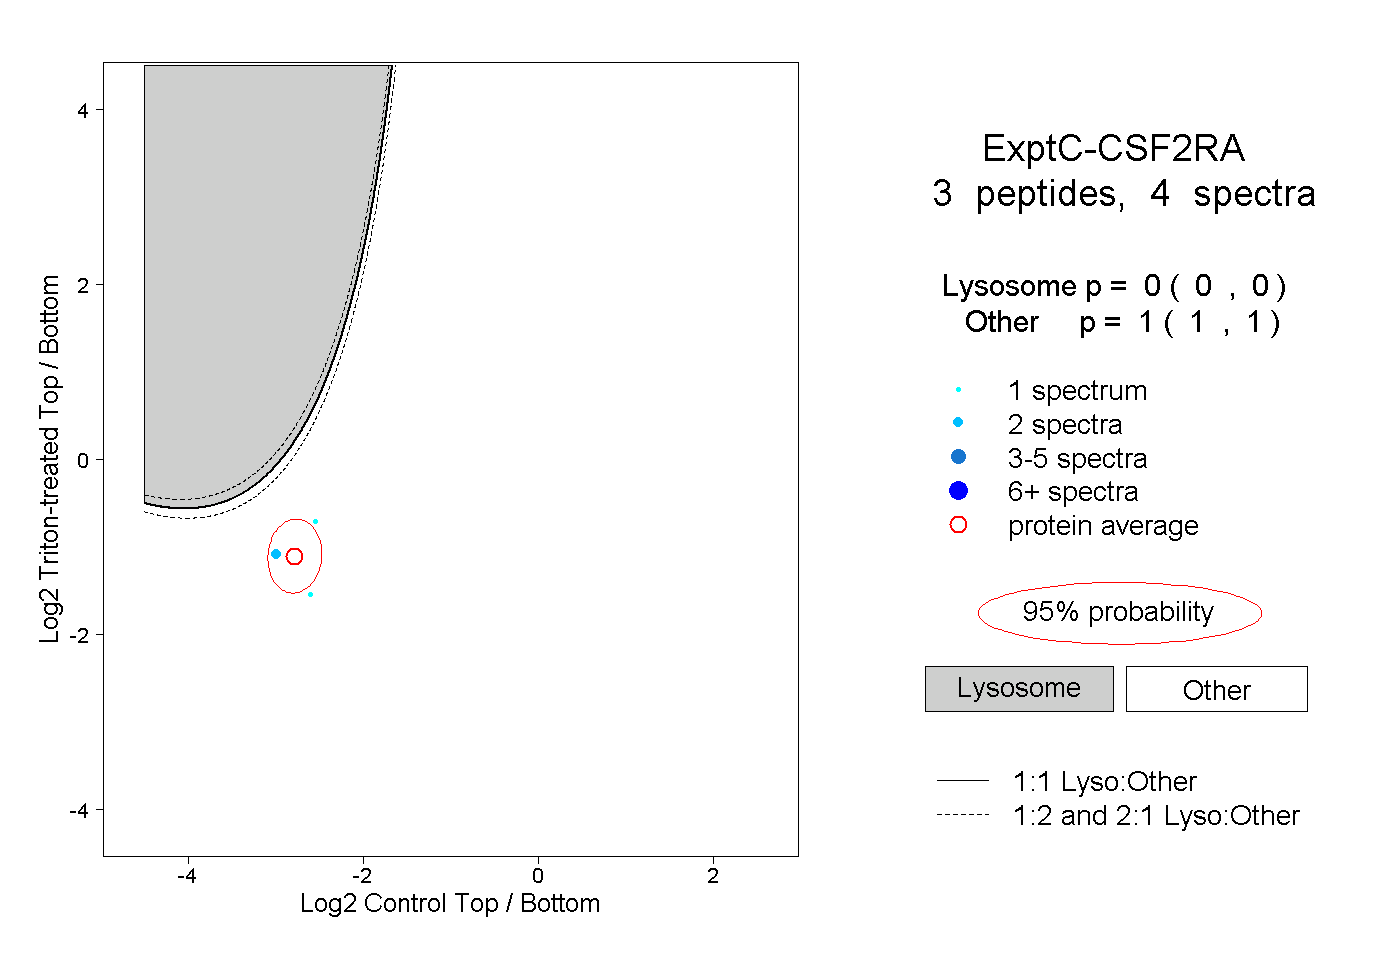
0.000 | 0.000
1.000 | 1.000
2peptides
spectra
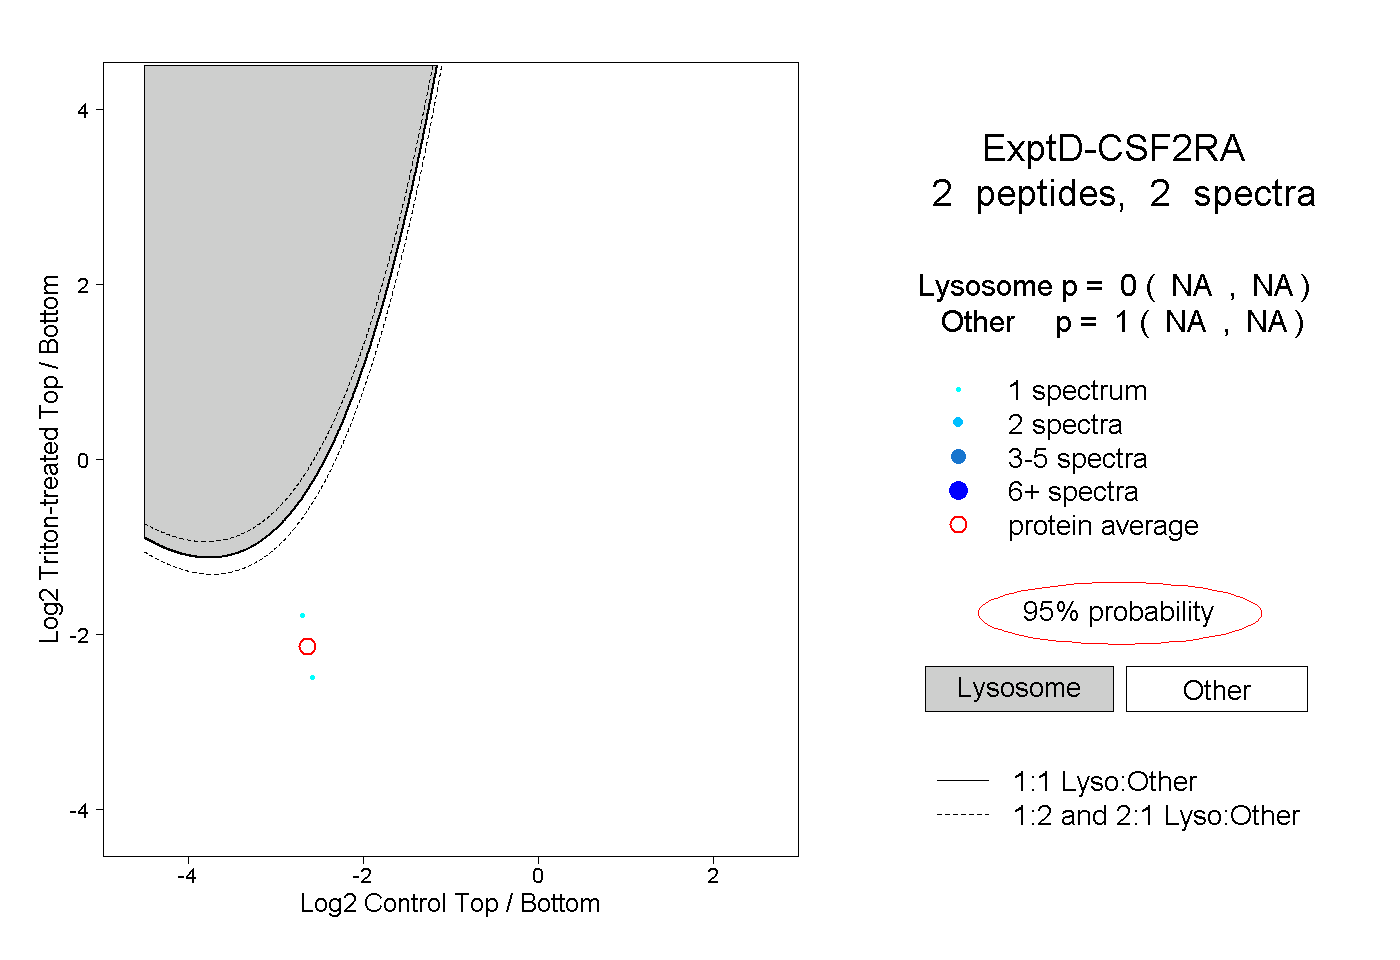
NA | NA
NA | NA