 91
91peptides
spectra
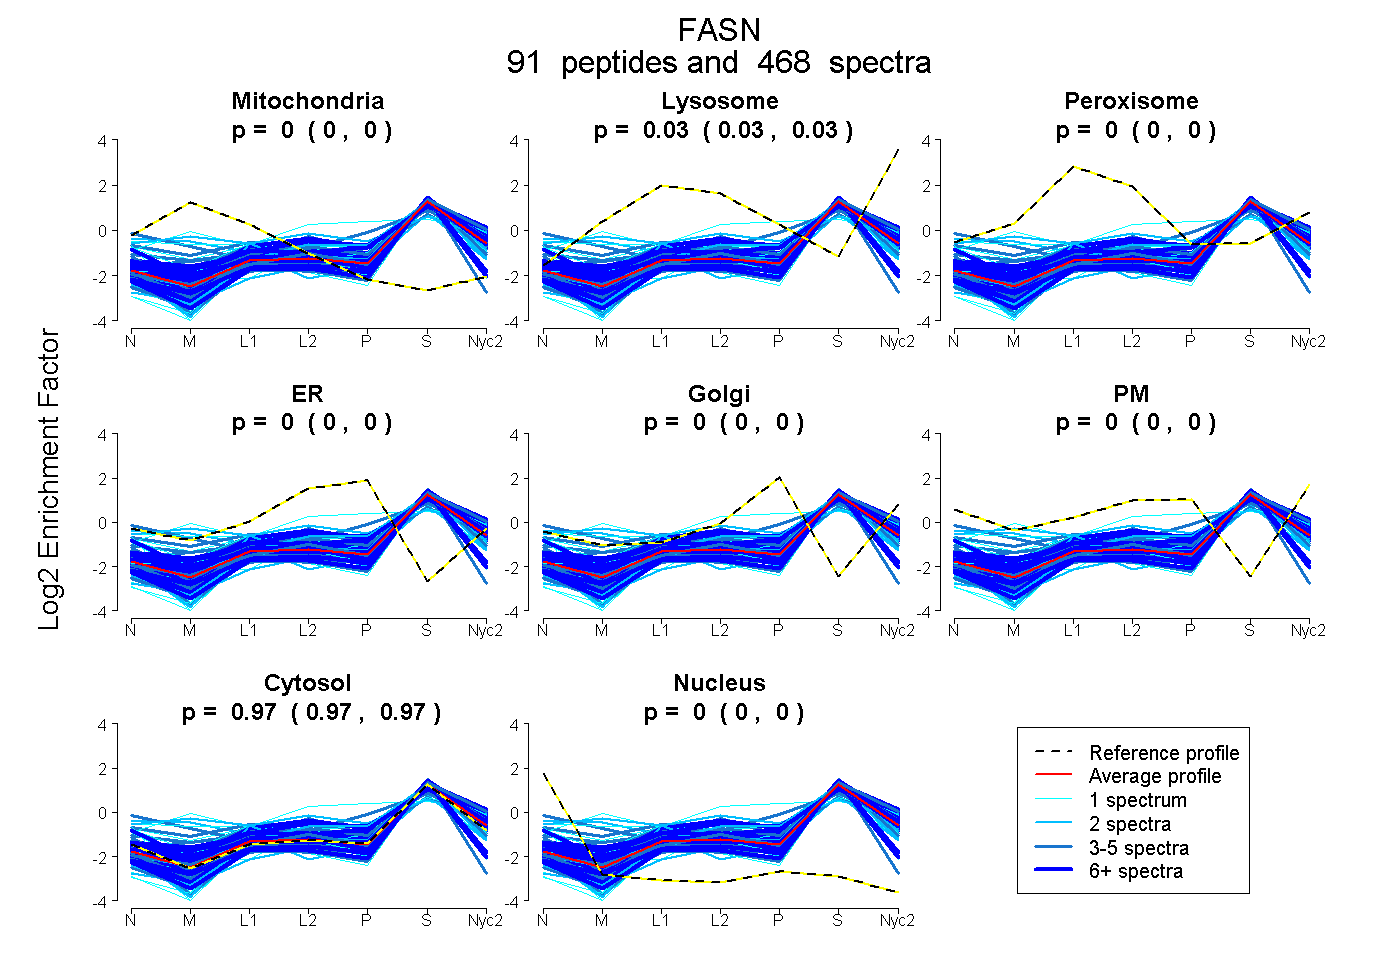
0.000 | 0.000
0.030 | 0.031
0.000 | 0.000
0.000 | 0.000
0.000 | 0.000
0.000 | 0.000
0.969 | 0.970
0.000 | 0.000
52peptides
spectra
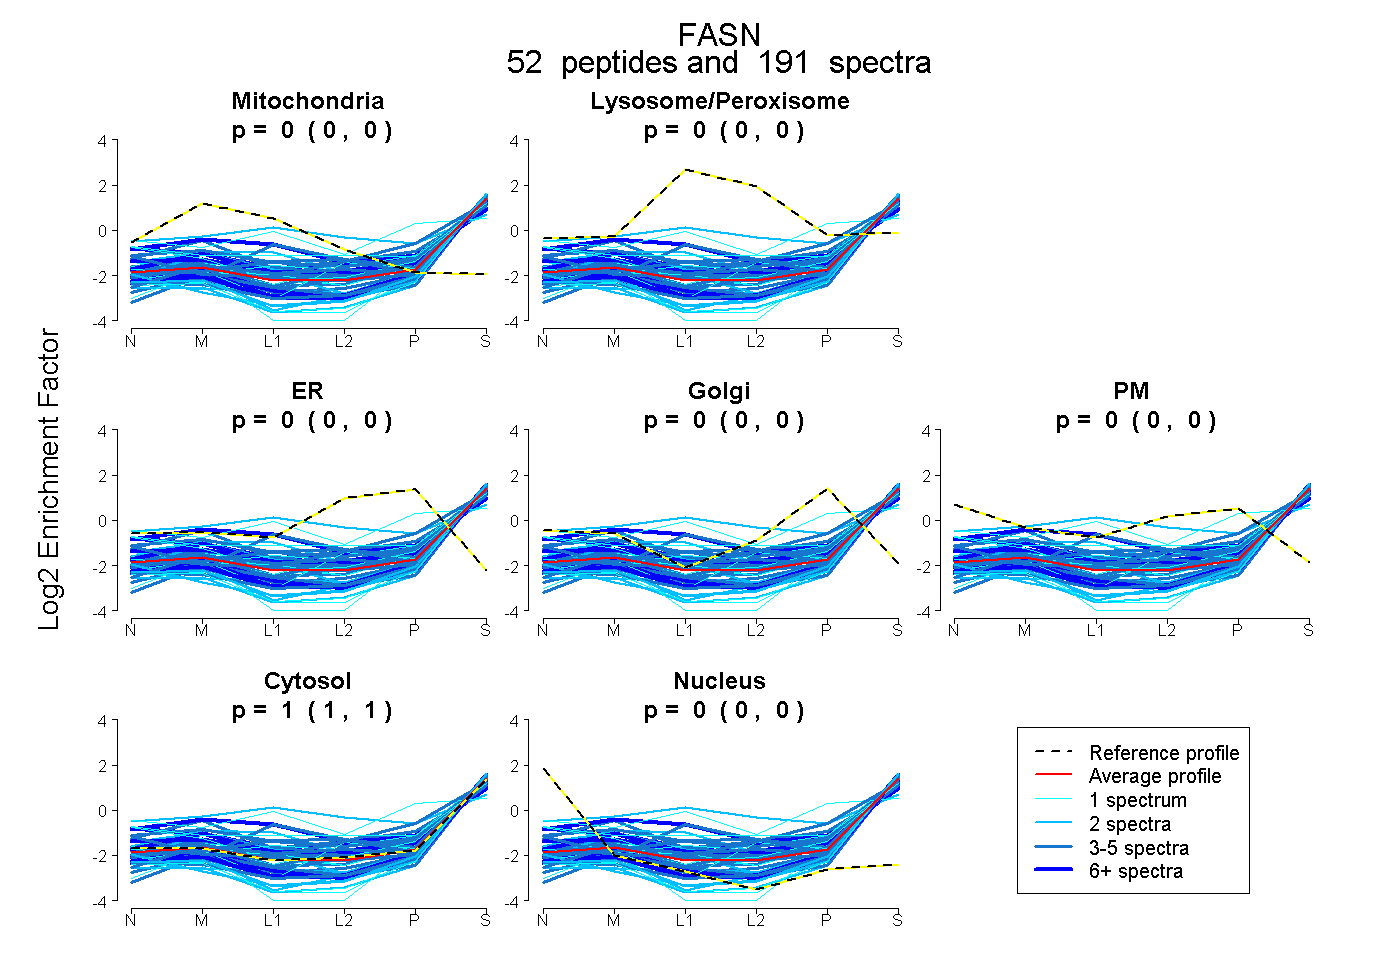
0.000 | 0.000
0.000 | 0.000
0.000 | 0.000
0.000 | 0.000
0.000 | 0.000
1.000 | 1.000
0.000 | 0.000
80peptides
spectra
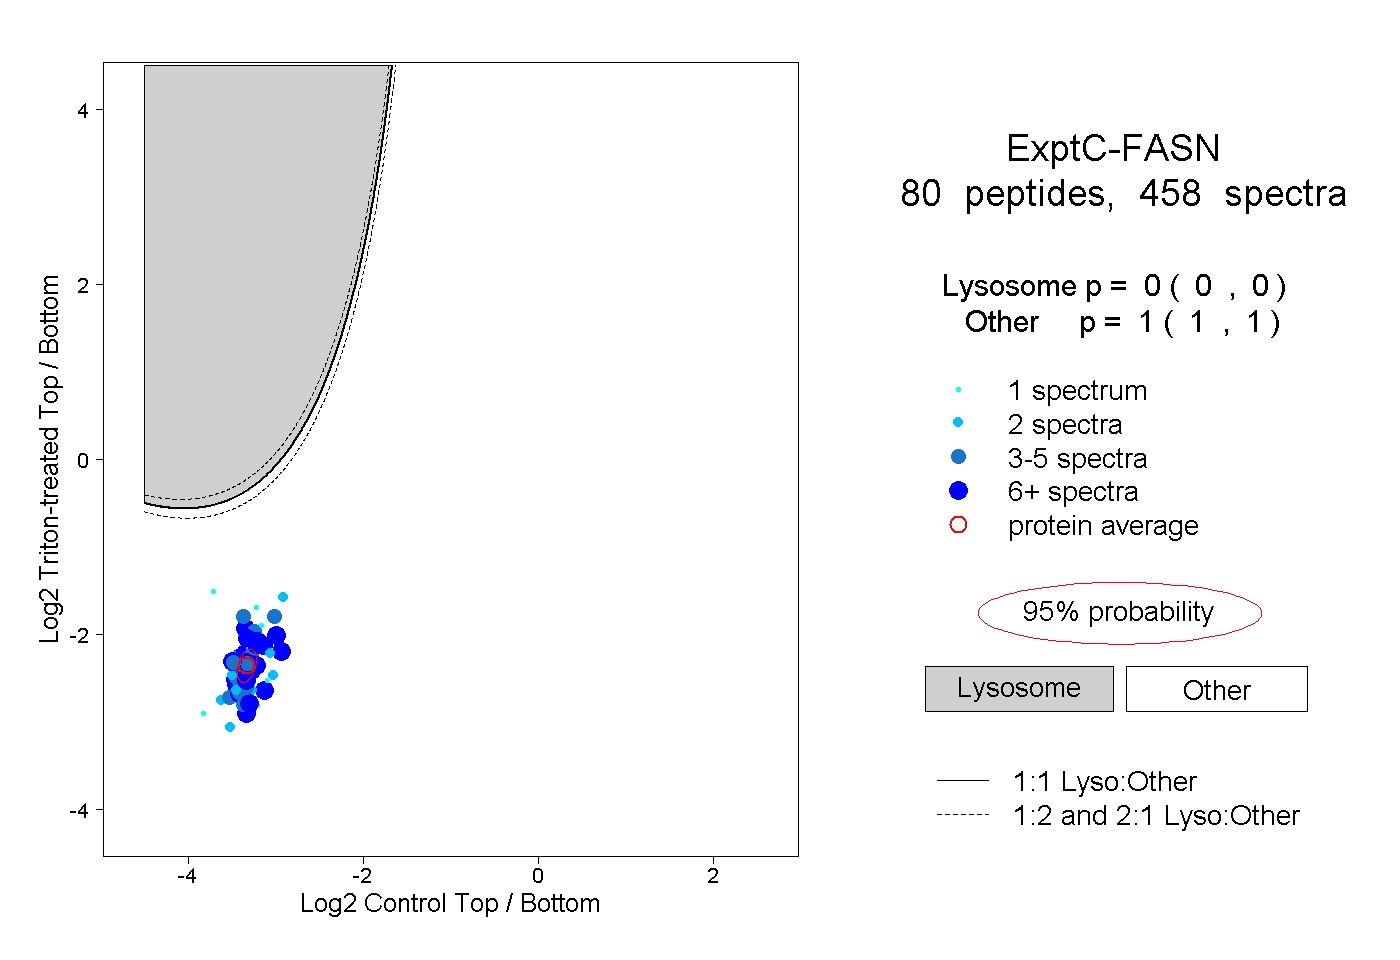
0.000 | 0.000
1.000 | 1.000
24peptides
spectra
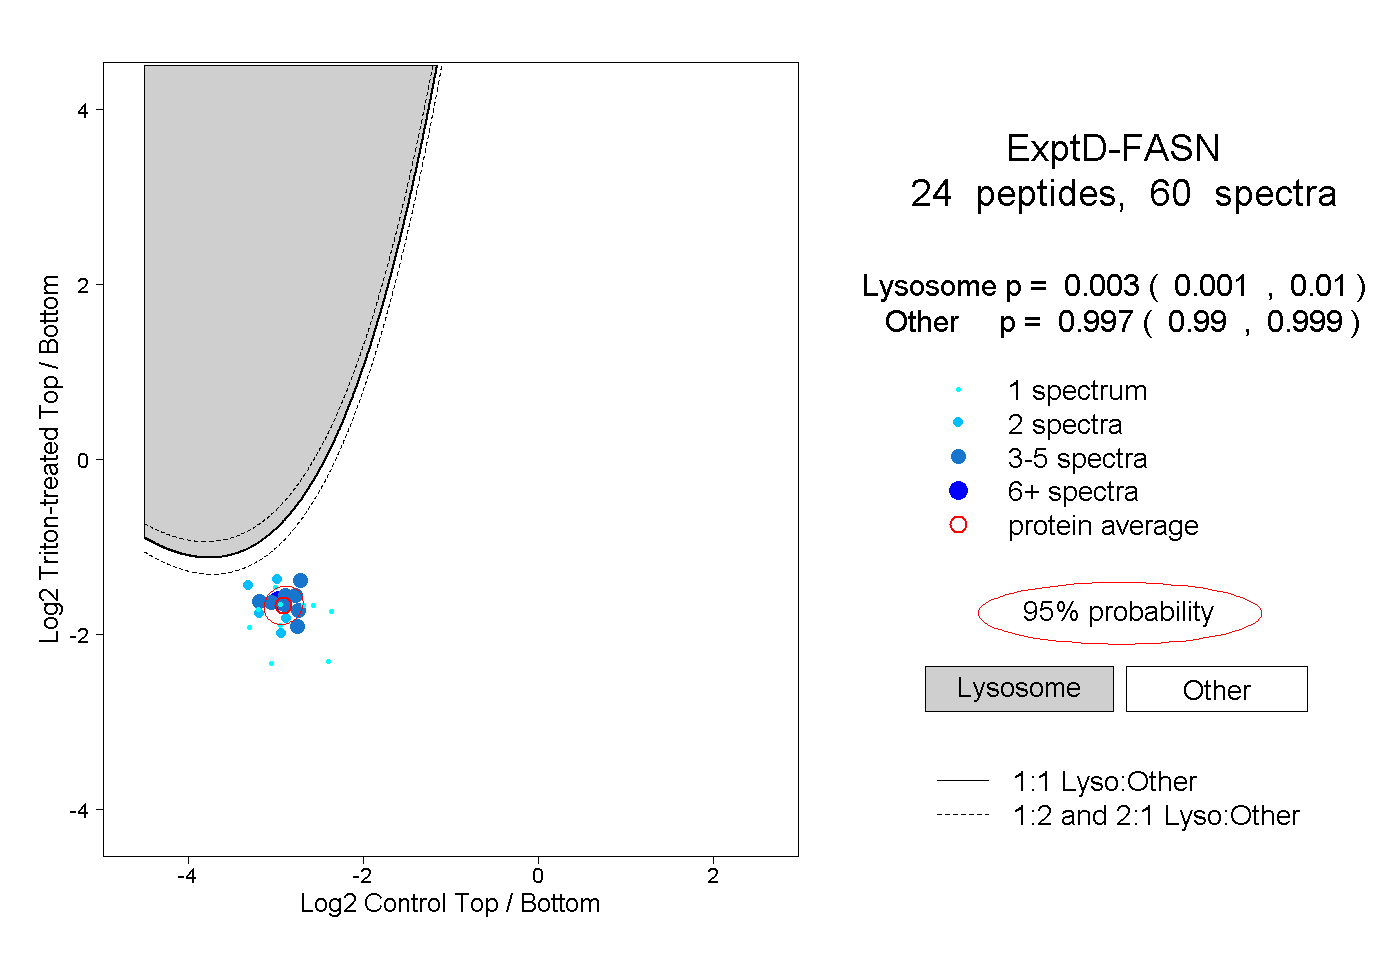
0.001 | 0.010
0.990 | 0.999