 1
1peptide
spectra

0.000 | 0.117
0.000 | 0.050
0.000 | 0.116
0.000 | 0.051
0.000 | 0.012
0.042 | 0.248
0.000 | 0.073
0.650 | 0.746
6peptides
spectra
0.000 | 0.000
1.000 | 1.000
| Plot | Mito | Lyso | Perox | ER | Golgi | PM | Cytosol | Nucleus | |||||
| Expt A |
1 peptide |
7 spectra |
|
0.059 0.000 | 0.117 |
0.000 0.000 | 0.050 |
0.024 0.000 | 0.116 |
0.000 0.000 | 0.051 |
0.000 0.000 | 0.012 |
0.196 0.042 | 0.248 |
0.022 0.000 | 0.073 |
0.699 0.650 | 0.746 |
||
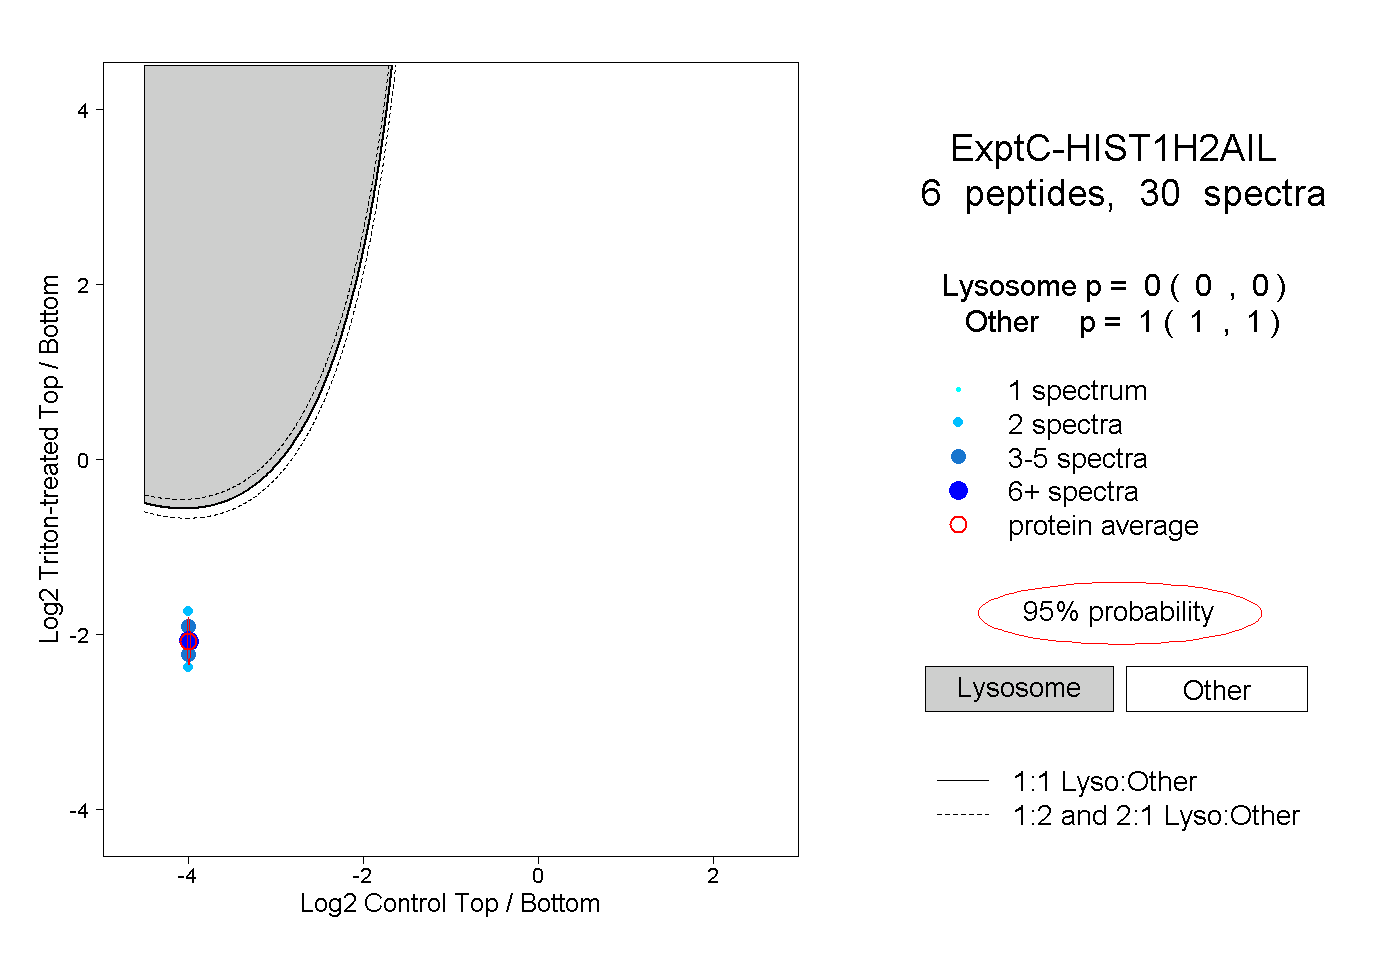
| Plot | Lyso | Other | |||||||||||
| Expt C |
6 peptides |
30 spectra |
|
0.000 0.000 | 0.000 |
1.000 1.000 | 1.000 |