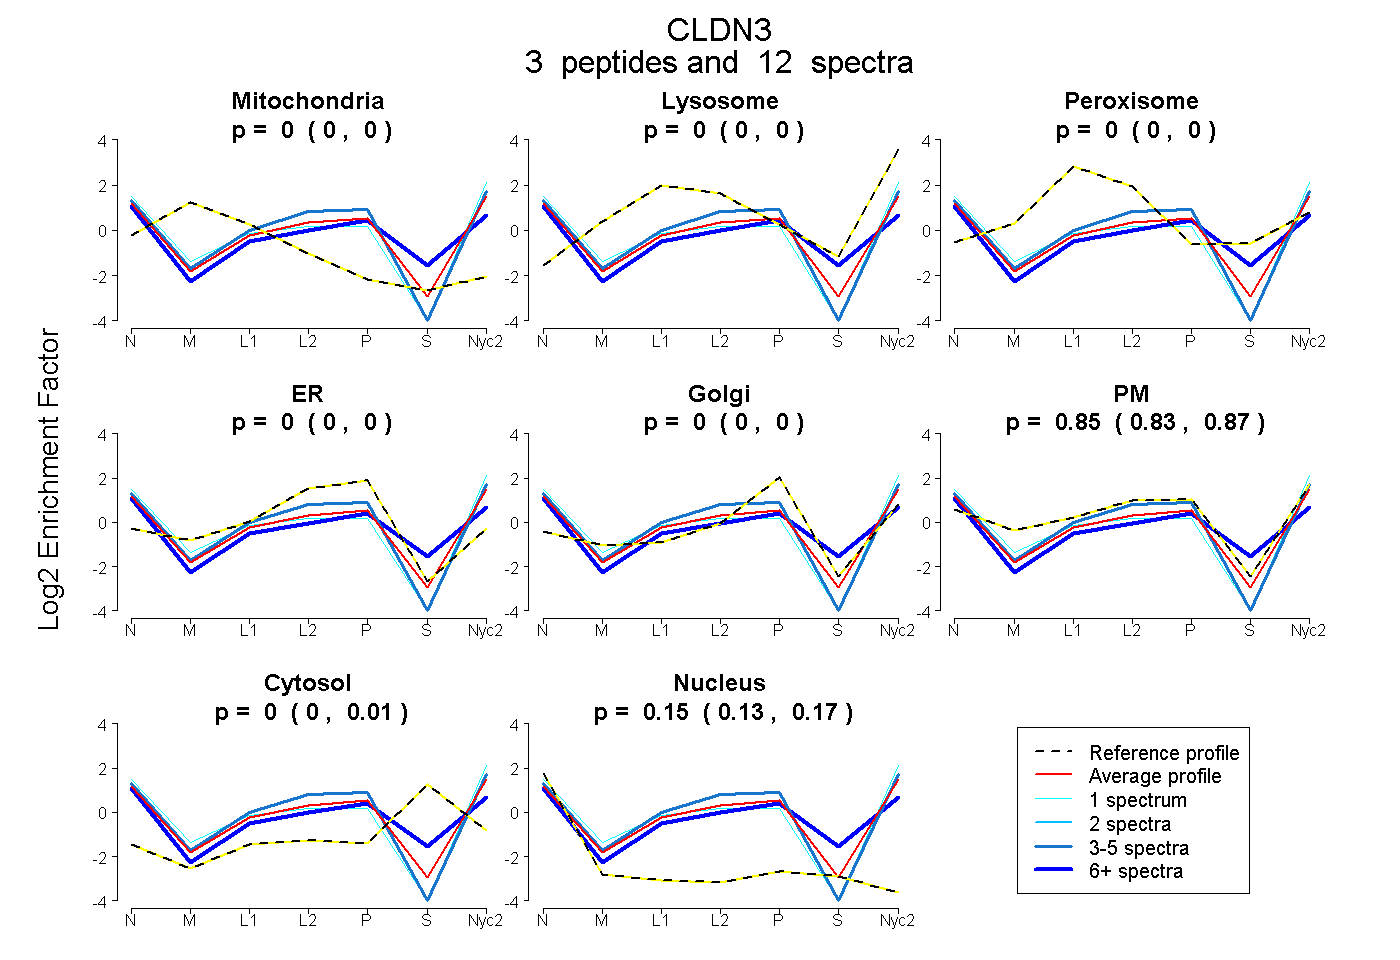
 3
3peptides
spectra
0.000 | 0.000
0.000 | 0.000
0.000 | 0.000
0.000 | 0.000
0.000 | 0.000
0.826 | 0.867
0.000 | 0.011
0.126 | 0.168
| Plot | Mito | Lyso | Perox | ER | Golgi | PM | Cytosol | Nucleus | |||||
| Expt A |
3 peptides |
12 spectra |
|
0.000 0.000 | 0.000 |
0.000 0.000 | 0.000 |
0.000 0.000 | 0.000 |
0.000 0.000 | 0.000 |
0.000 0.000 | 0.000 |
0.850 0.826 | 0.867 |
0.000 0.000 | 0.011 |
0.150 0.126 | 0.168 |
| 8 spectra, ILYSAPR | 0.000 | 0.000 | 0.000 | 0.000 | 0.005 | 0.653 | 0.193 | 0.149 | ||
| 1 spectrum, DFYNPLVPEAQK | 0.000 | 0.000 | 0.000 | 0.000 | 0.000 | 0.875 | 0.000 | 0.125 | ||
| 3 spectra, STGPGTGTGTAYDR | 0.000 | 0.000 | 0.000 | 0.000 | 0.000 | 0.917 | 0.000 | 0.083 |
| Plot | Mito | Lyso or Perox | ER | Golgi | PM | Cytosol | Nucleus | ||||||
| Expt B |
1 peptide |
2 spectra |
 |
0.000 NA | NA |
0.289 NA | NA |
0.000 NA | NA |
0.000 NA | NA |
0.681 NA | NA |
0.030 NA | NA |
0.000 NA | NA |
|||
| Plot | Lyso | Other | |||||||||||
| Expt C |
2 peptides |
14 spectra |
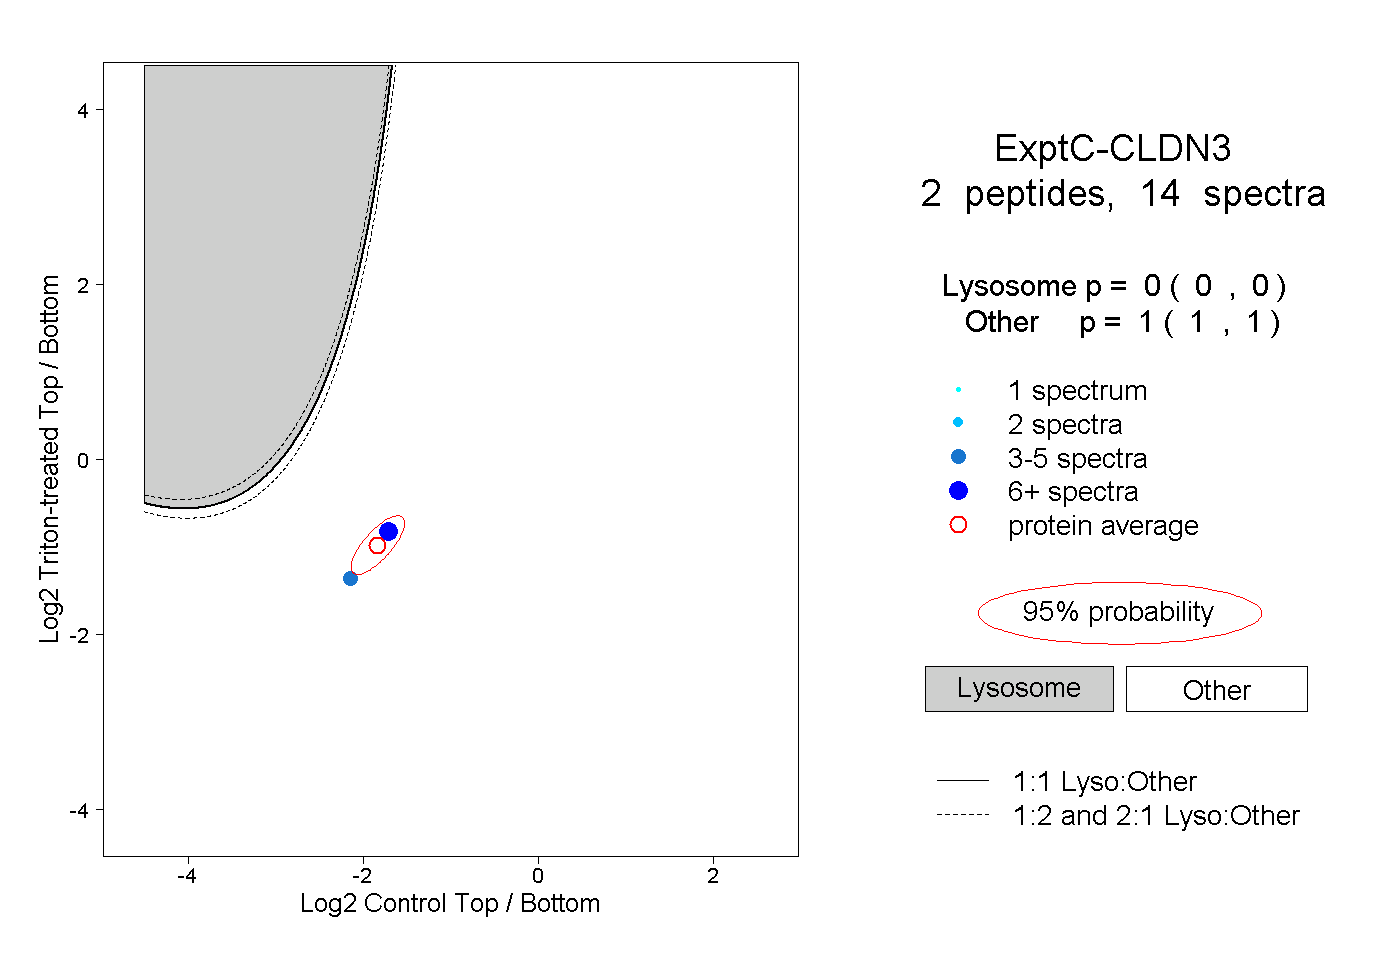 |
0.000 0.000 | 0.000 |
1.000 1.000 | 1.000 |
||||||||
| Plot | Lyso | Other | |||||||||||
| Expt D |
1 peptide |
1 spectrum |
 |
0.000 NA | NA |
1.000 NA | NA |