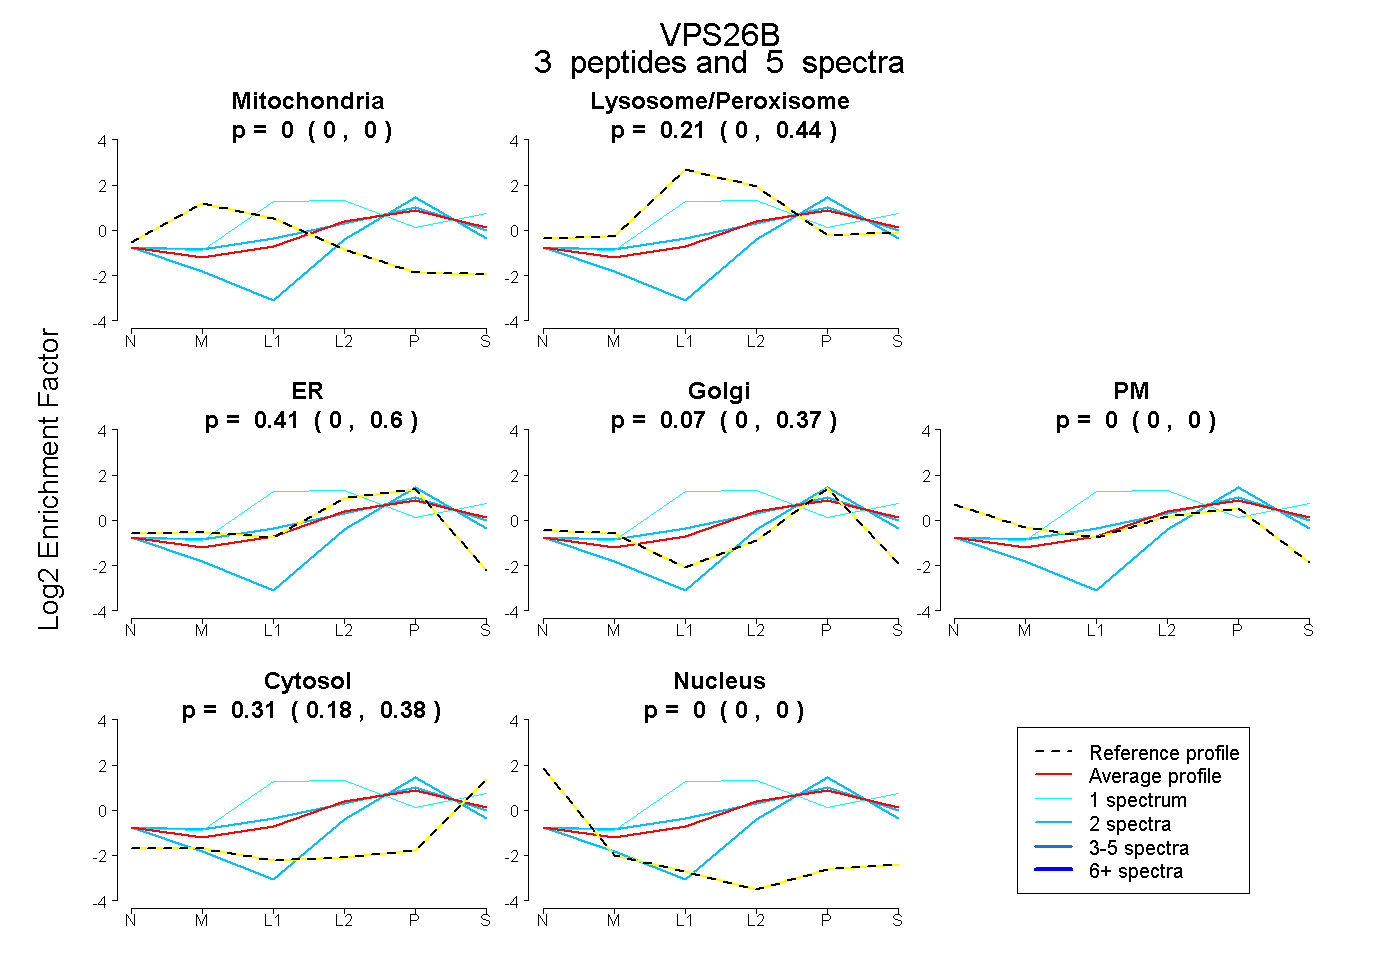
VPS26B
[ENSRNOP00000064289]
Main page
| | | Plot |
Mito |
Lyso |
|
Perox |
ER |
Golgi |
PM |
Cytosol |
Nucleus |
|
| Expt A |
 11
11
peptides |
30
spectra |
 |
0.000
0.000 | 0.000 |
0.135
0.123 | 0.144 |
|
0.000
0.000 | 0.000 |
0.000
0.000 | 0.000 |
0.434
0.427 | 0.440 |
0.000
0.000 | 0.000 |
0.431
0.424 | 0.437 |
0.000
0.000 | 0.000 |
|
| | | Plot |
Mito |
|
Lyso or Perox |
|
ER |
Golgi |
PM |
Cytosol |
Nucleus |
|
| Expt B |
3
peptides |
5
spectra |
 |
0.000
0.000 | 0.000 |
|
0.214
0.000 | 0.437 |
|
0.411
0.000 | 0.601 |
0.070
0.000 | 0.369 |
0.000
0.000 | 0.000 |
0.305
0.178 | 0.380 |
0.000
0.000 | 0.000 |
|
| 2 spectra, LEHQGIK |
0.000 |
|
0.373 |
|
0.062 |
0.397 |
0.000 |
0.167 |
0.000 |
|
| 1 spectrum, VSLSLK |
0.000 |
|
0.727 |
|
0.044 |
0.000 |
0.000 |
0.230 |
0.000 |
|
| 2 spectra, FEGTTSLGEVR |
0.000 |
|
0.000 |
|
0.000 |
0.751 |
0.000 |
0.249 |
0.000 |
|
| | | Plot |
|
Lyso |
|
|
|
|
|
|
|
Other |
| Expt C |
13
peptides |
49
spectra |
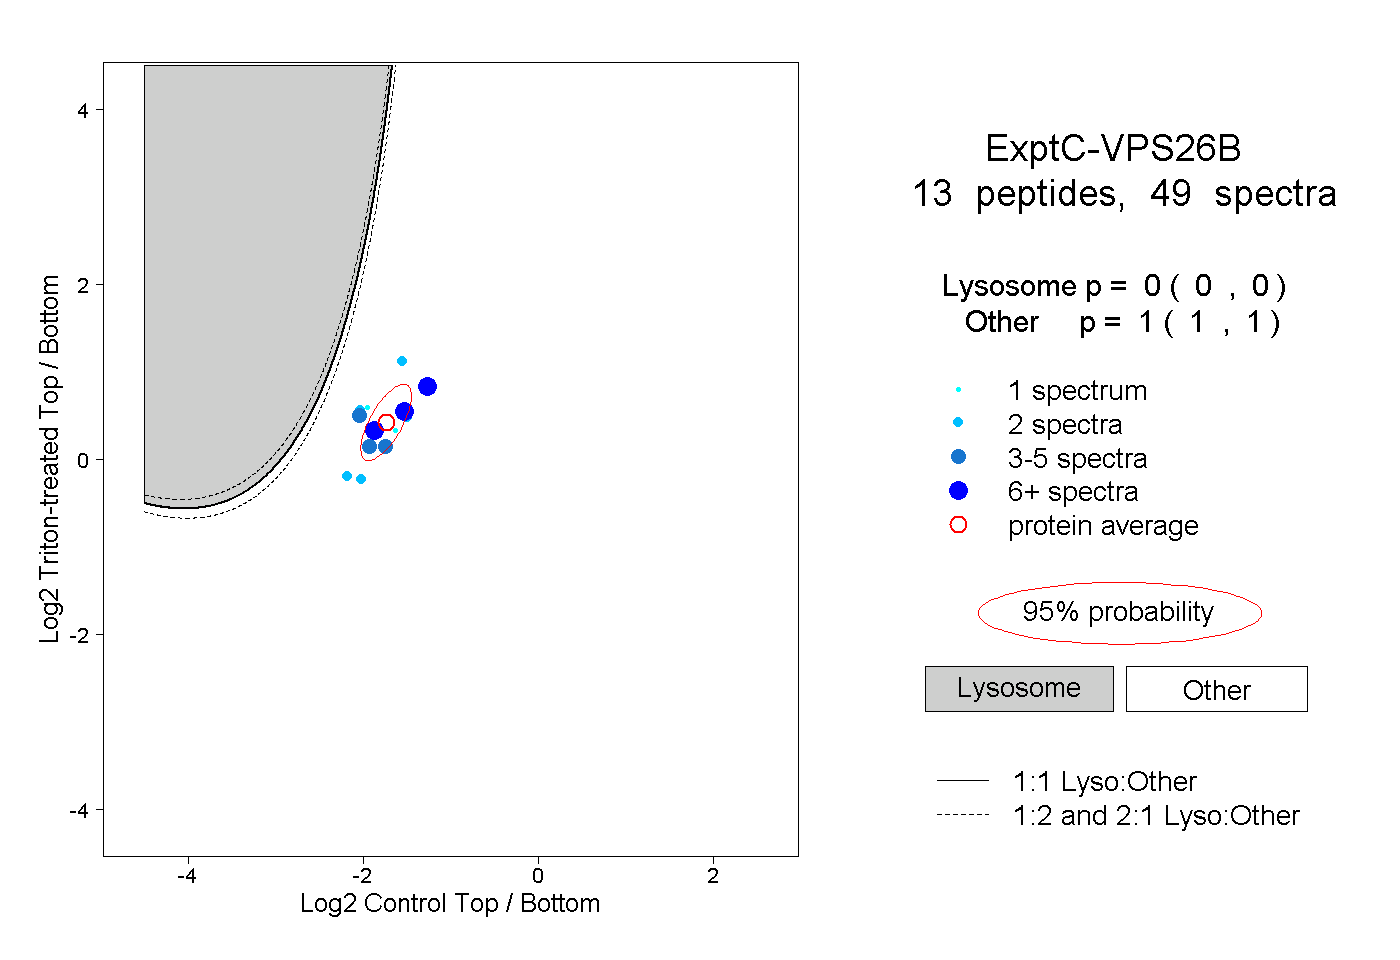 |
|
0.000
0.000 | 0.000 |
|
|
|
|
|
|
|
1.000
1.000 | 1.000 |
| | | Plot |
|
Lyso |
|
|
|
|
|
|
|
Other |
| Expt D |
3
peptides |
3
spectra |
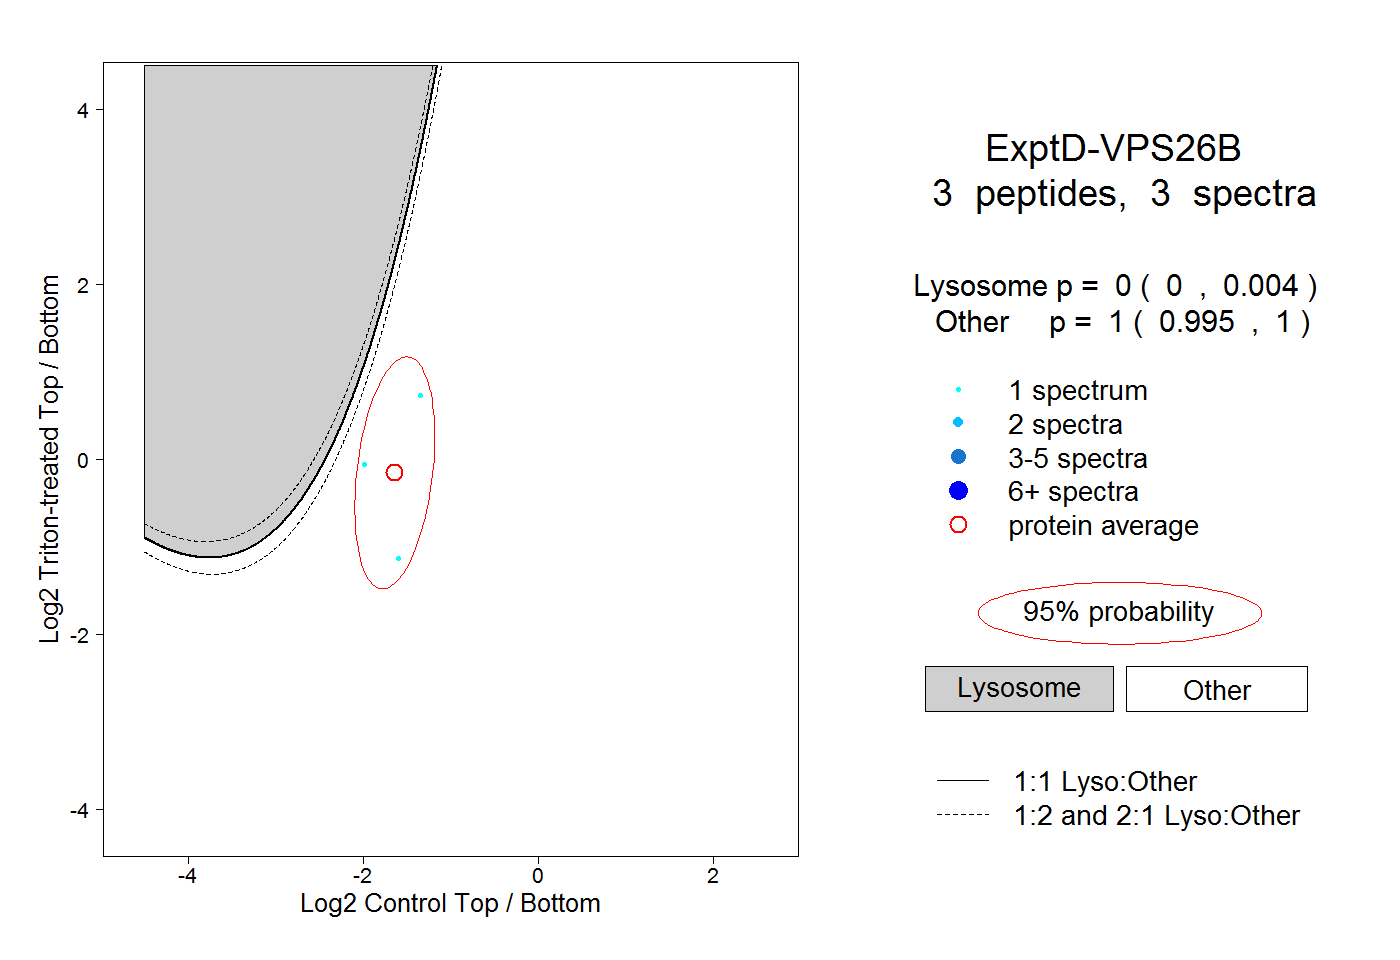 |
|
0.000
0.000 | 0.004 |
|
|
|
|
|
|
|
1.000
0.995 | 1.000 |