 11
11peptides
spectra

0.000 | 0.000
0.123 | 0.144
0.000 | 0.000
0.000 | 0.000
0.427 | 0.440
0.000 | 0.000
0.424 | 0.437
0.000 | 0.000
| Plot | Mito | Lyso | Perox | ER | Golgi | PM | Cytosol | Nucleus | |||||
| Expt A |
11 peptides |
30 spectra |
|
0.000 0.000 | 0.000 |
0.135 0.123 | 0.144 |
0.000 0.000 | 0.000 |
0.000 0.000 | 0.000 |
0.434 0.427 | 0.440 |
0.000 0.000 | 0.000 |
0.431 0.424 | 0.437 |
0.000 0.000 | 0.000 |
| 3 spectra, QQEVVLWR | 0.000 | 0.227 | 0.000 | 0.000 | 0.454 | 0.000 | 0.319 | 0.000 | ||
| 6 spectra, SMSHQAAIASQR | 0.000 | 0.000 | 0.038 | 0.026 | 0.447 | 0.000 | 0.489 | 0.000 | ||
| 1 spectrum, GNHHEFVSLVK | 0.000 | 0.083 | 0.000 | 0.000 | 0.311 | 0.123 | 0.482 | 0.000 | ||
| 1 spectrum, LNDVVK | 0.000 | 0.308 | 0.000 | 0.000 | 0.378 | 0.000 | 0.314 | 0.000 | ||
| 1 spectrum, LFLAGYELTPTMR | 0.000 | 0.261 | 0.000 | 0.000 | 0.313 | 0.122 | 0.303 | 0.000 | ||
| 3 spectra, HMEIDIIK | 0.000 | 0.234 | 0.000 | 0.000 | 0.304 | 0.000 | 0.462 | 0.000 | ||
| 1 spectrum, YFLFYDGETVSGK | 0.000 | 0.120 | 0.000 | 0.000 | 0.353 | 0.000 | 0.527 | 0.000 | ||
| 5 spectra, YEIMDGAPVR | 0.000 | 0.181 | 0.000 | 0.000 | 0.410 | 0.000 | 0.408 | 0.000 | ||
| 2 spectra, VSLSLK | 0.000 | 0.282 | 0.000 | 0.000 | 0.362 | 0.000 | 0.356 | 0.000 | ||
| 2 spectra, TPGQLSDNNSR | 0.000 | 0.000 | 0.000 | 0.000 | 0.420 | 0.000 | 0.580 | 0.000 | ||
| 5 spectra, FEGTTSLGEVR | 0.000 | 0.000 | 0.000 | 0.000 | 0.499 | 0.000 | 0.501 | 0.000 |
| Plot | Mito | Lyso or Perox | ER | Golgi | PM | Cytosol | Nucleus | ||||||
| Expt B |
3 peptides |
5 spectra |
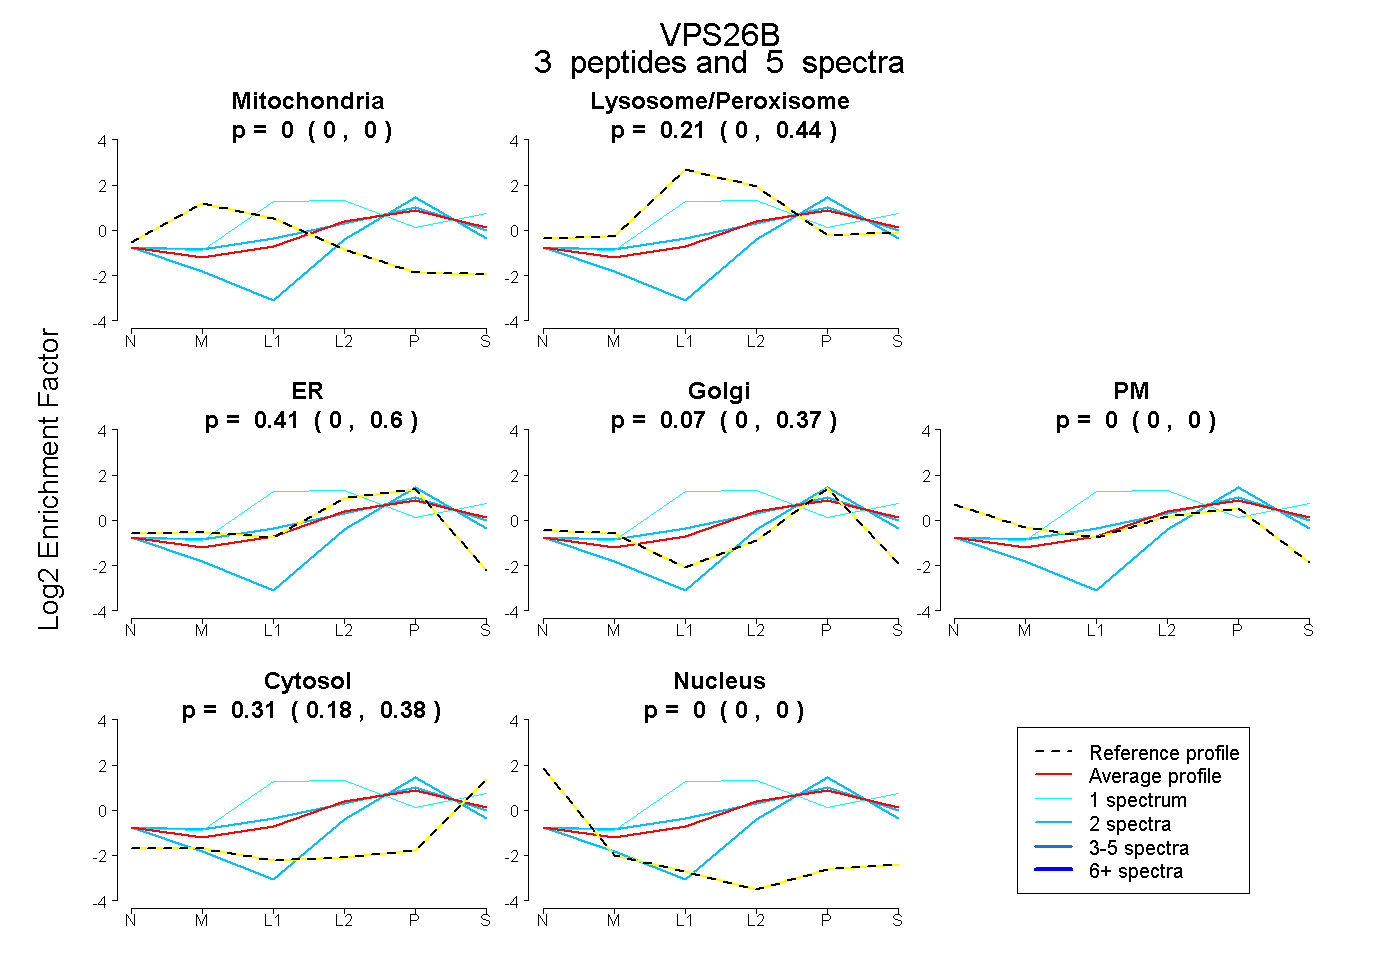 |
0.000 0.000 | 0.000 |
0.214 0.000 | 0.437 |
0.411 0.000 | 0.601 |
0.070 0.000 | 0.369 |
0.000 0.000 | 0.000 |
0.305 0.178 | 0.380 |
0.000 0.000 | 0.000 |
|||
| Plot | Lyso | Other | |||||||||||
| Expt C |
13 peptides |
49 spectra |
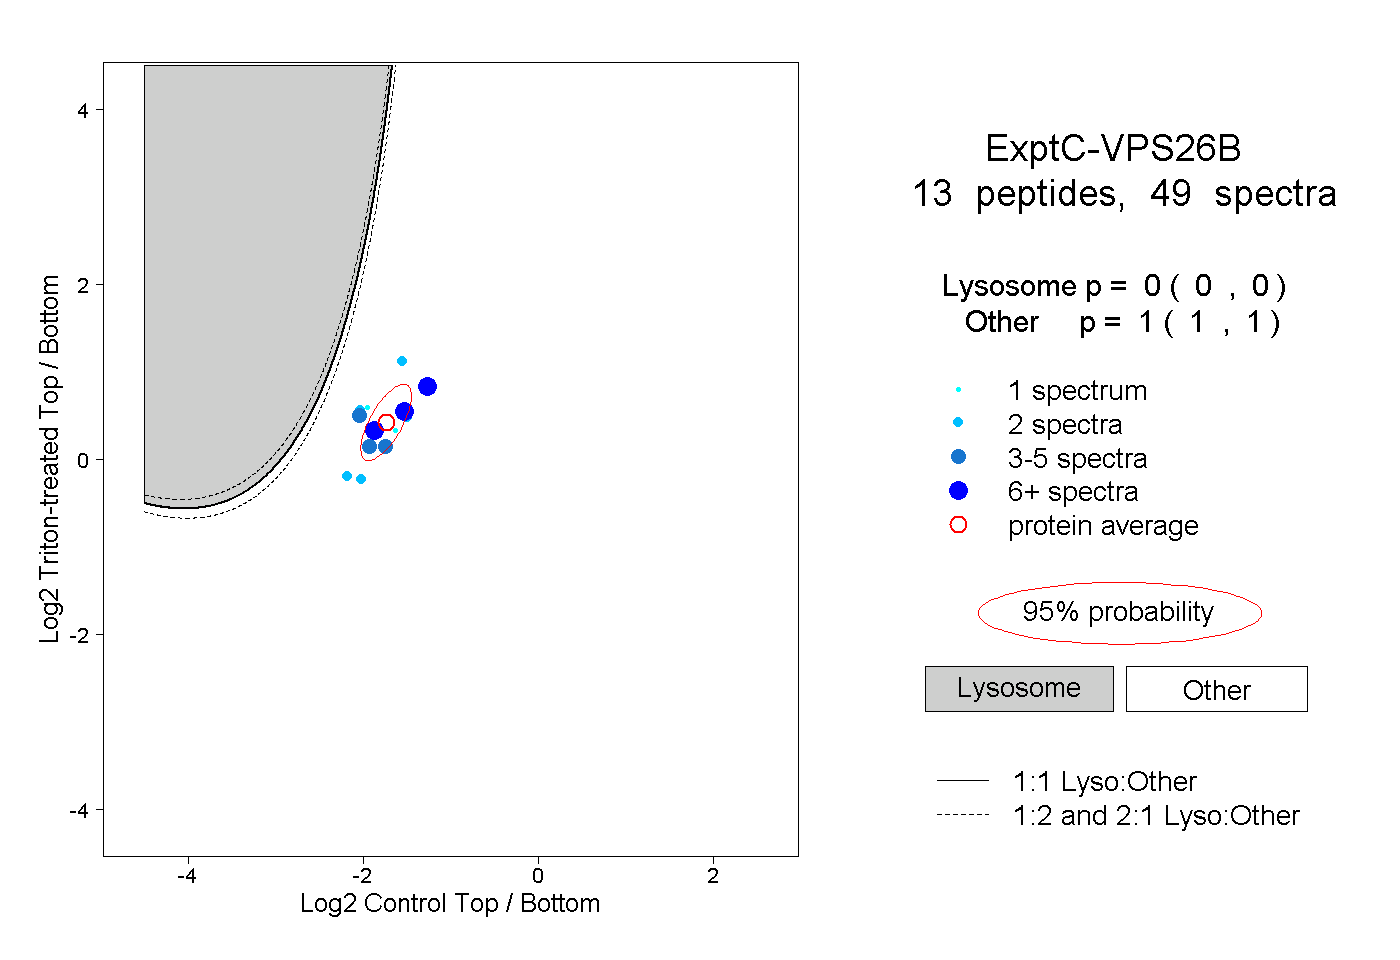 |
0.000 0.000 | 0.000 |
1.000 1.000 | 1.000 |
||||||||
| Plot | Lyso | Other | |||||||||||
| Expt D |
3 peptides |
3 spectra |
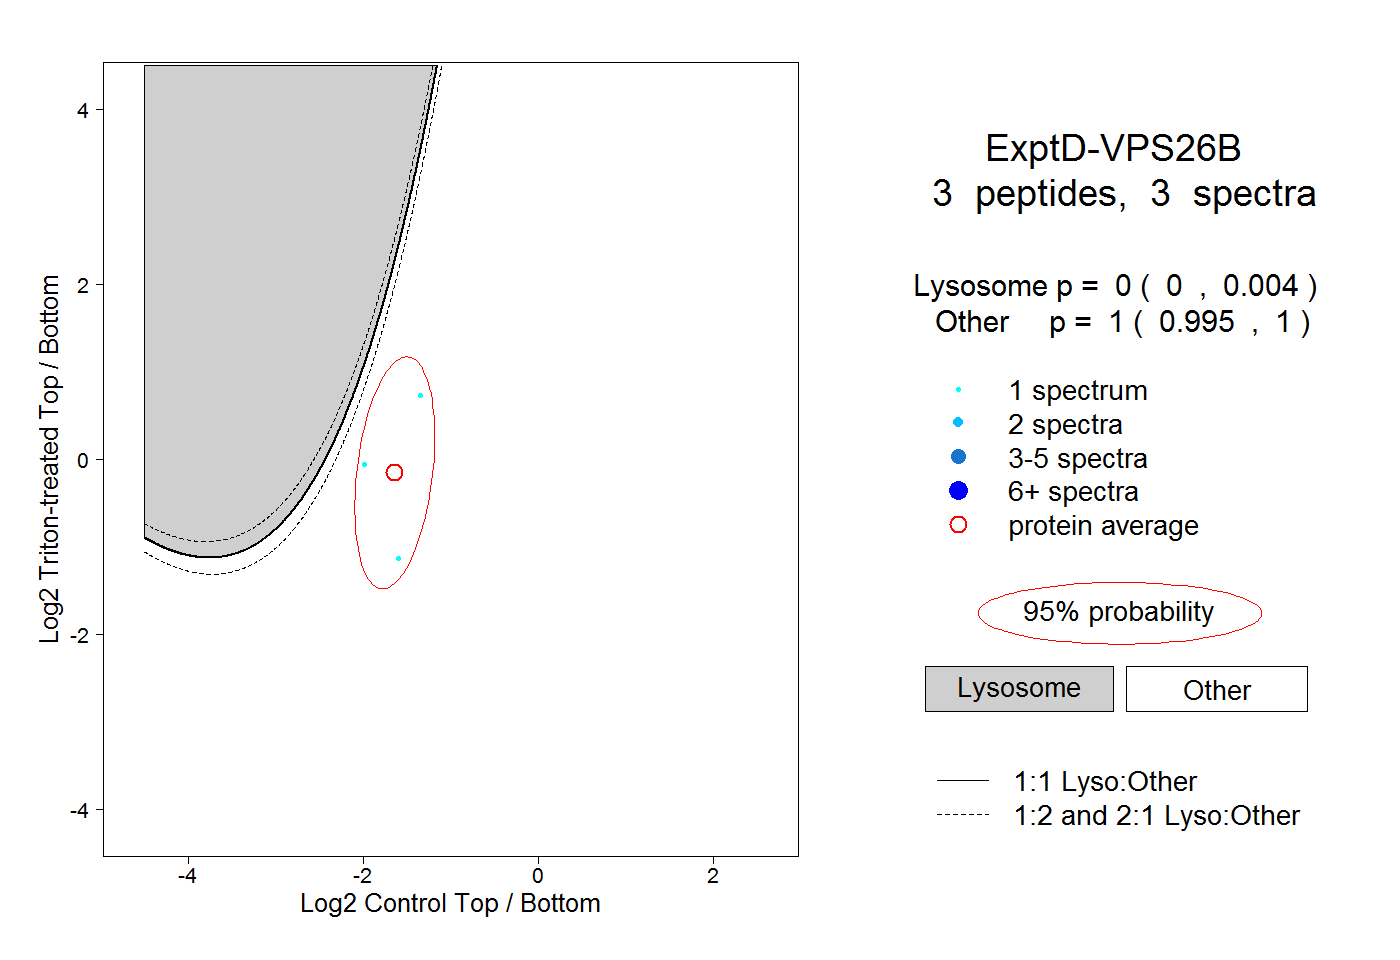 |
0.000 0.000 | 0.004 |
1.000 0.995 | 1.000 |