 37
37peptides
spectra
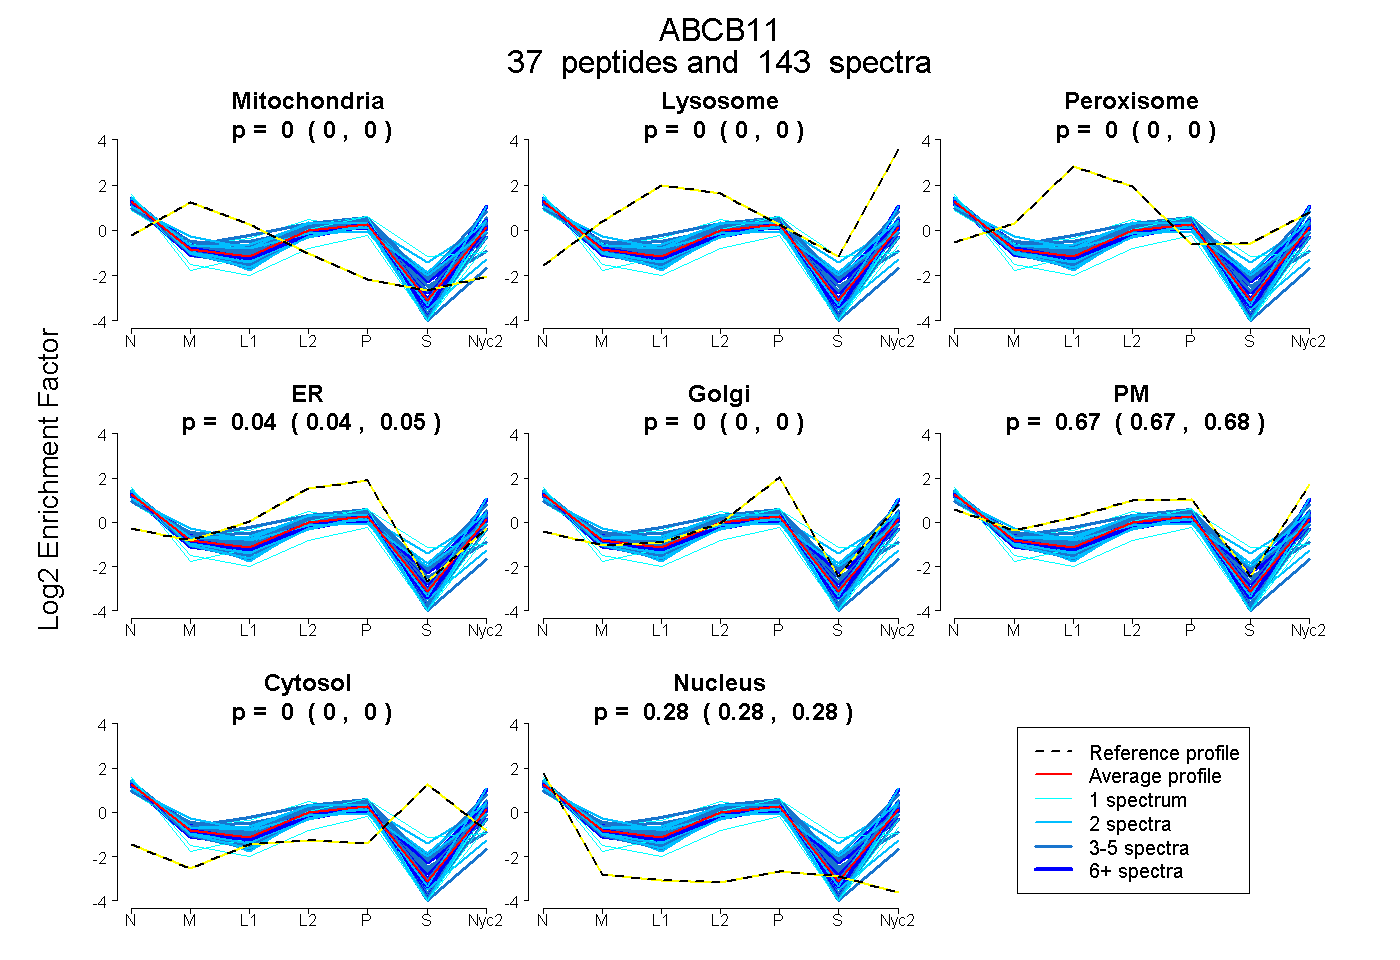
0.000 | 0.000
0.000 | 0.000
0.000 | 0.000
0.040 | 0.049
0.000 | 0.000
0.668 | 0.679
0.000 | 0.000
0.280 | 0.282
17peptides
spectra
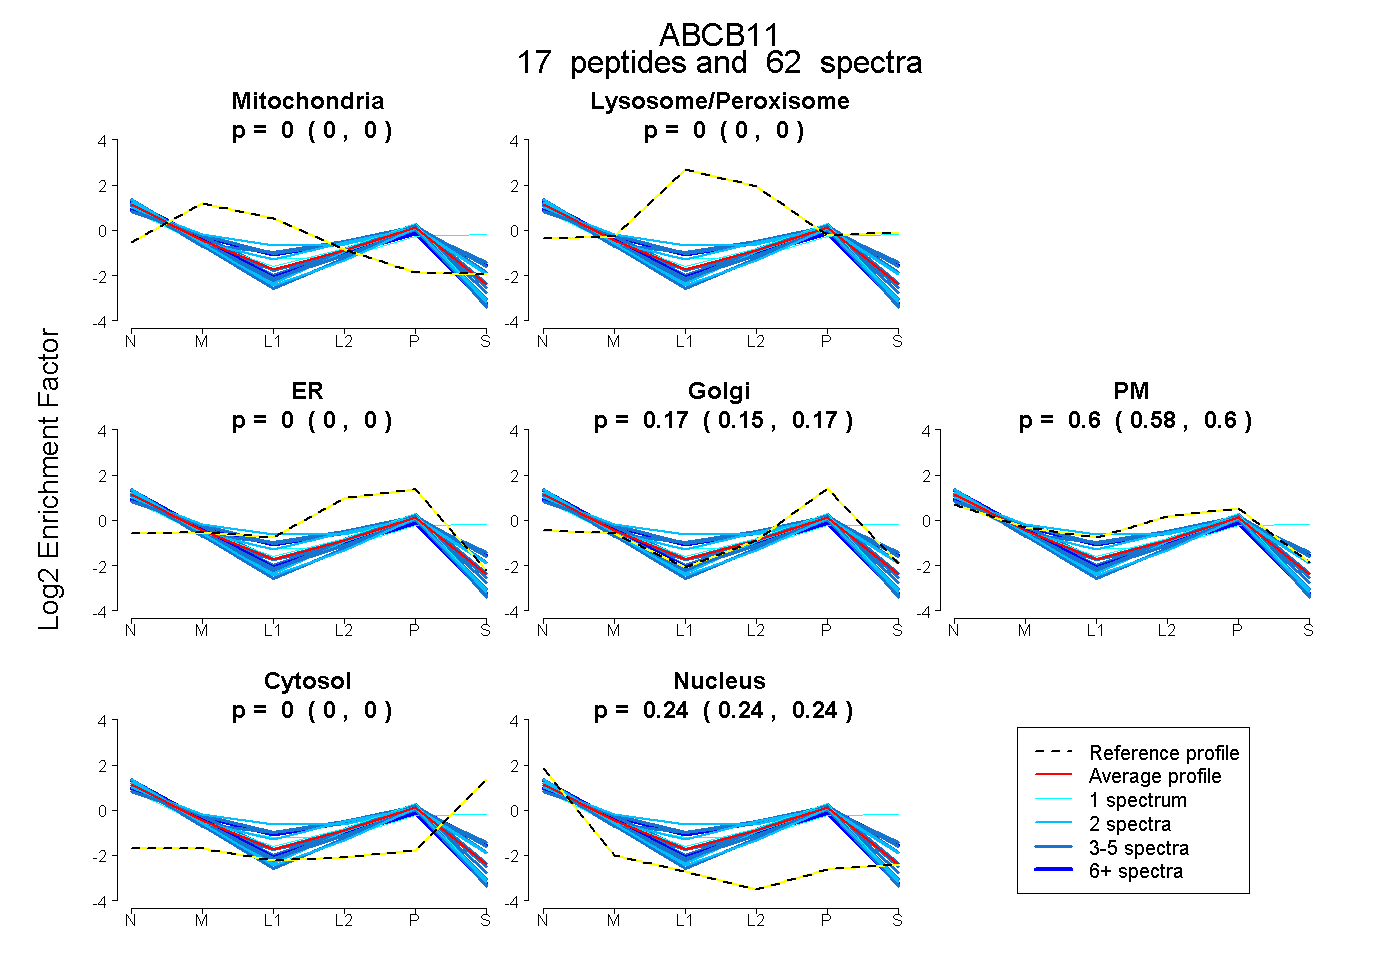
0.000 | 0.000
0.000 | 0.000
0.000 | 0.000
0.155 | 0.173
0.583 | 0.605
0.000 | 0.000
0.237 | 0.242
33peptides
spectra
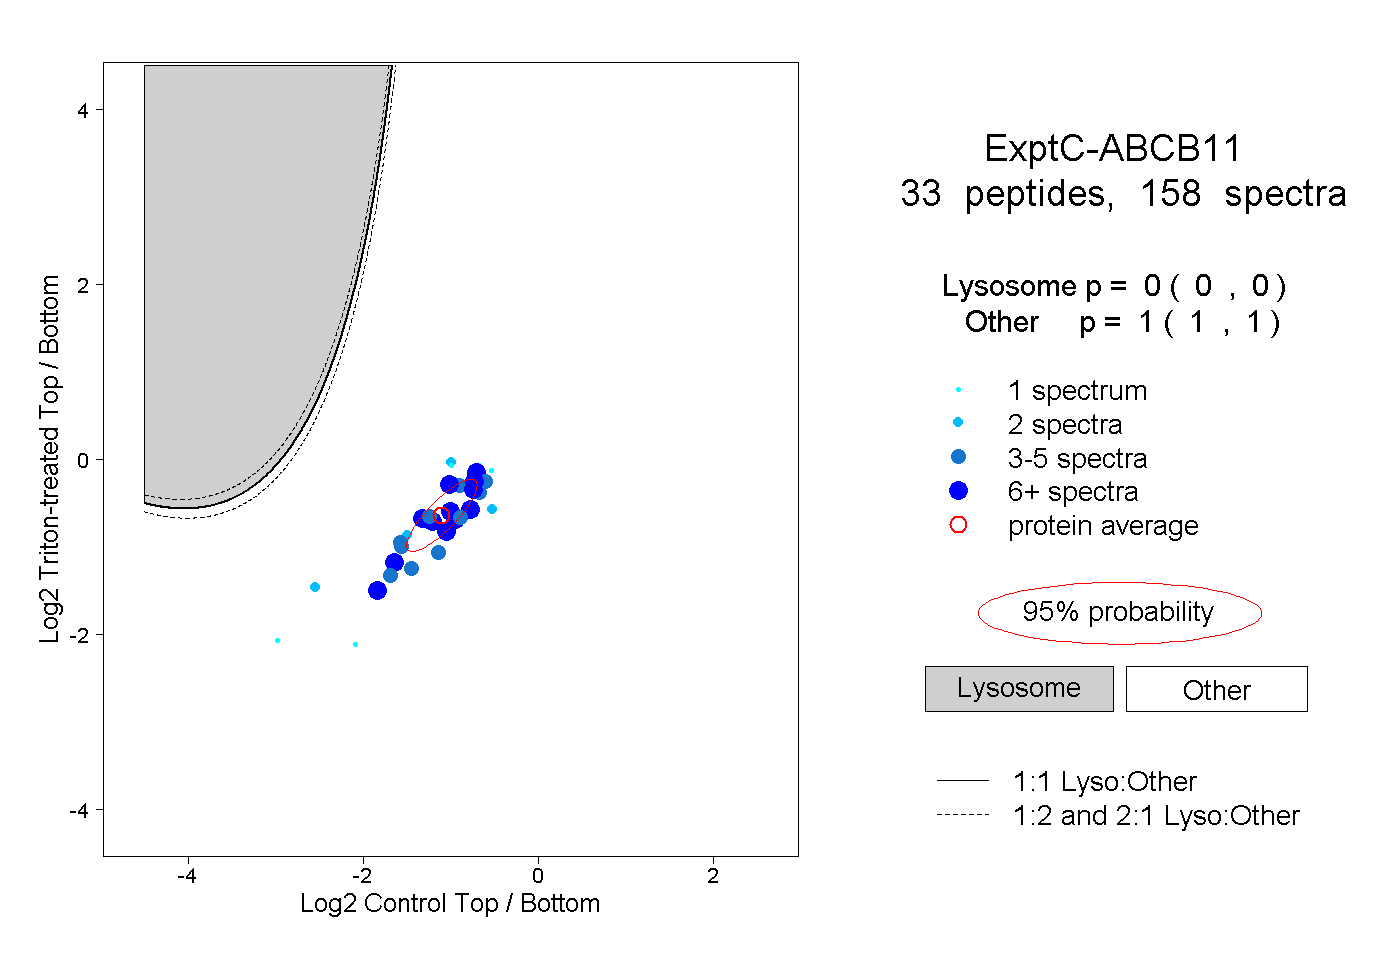
0.000 | 0.000
1.000 | 1.000
11peptides
spectra
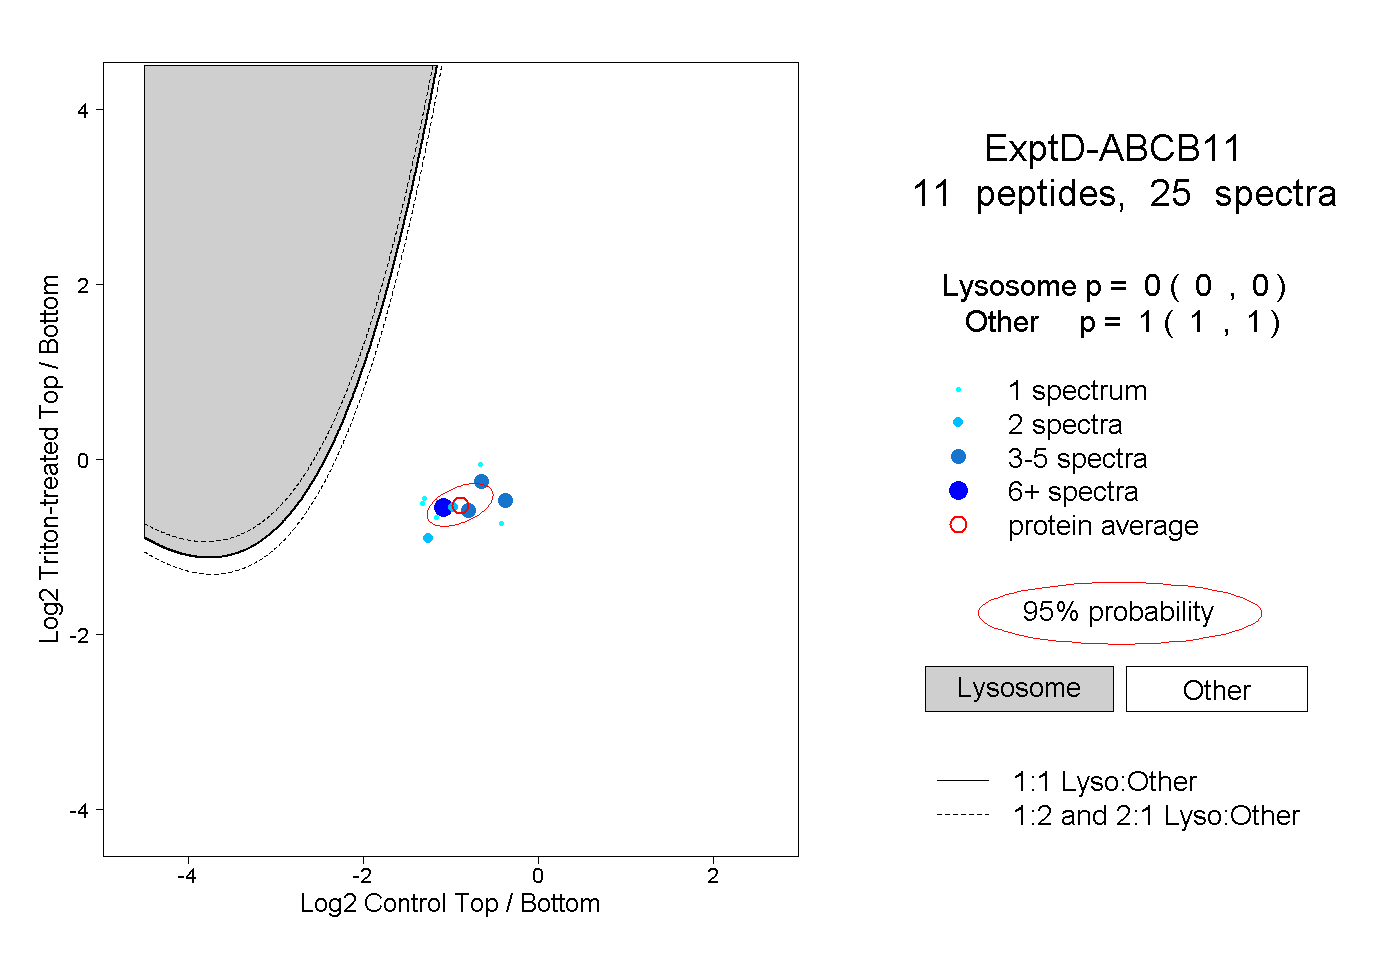
0.000 | 0.000
1.000 | 1.000