 4
4peptides
spectra
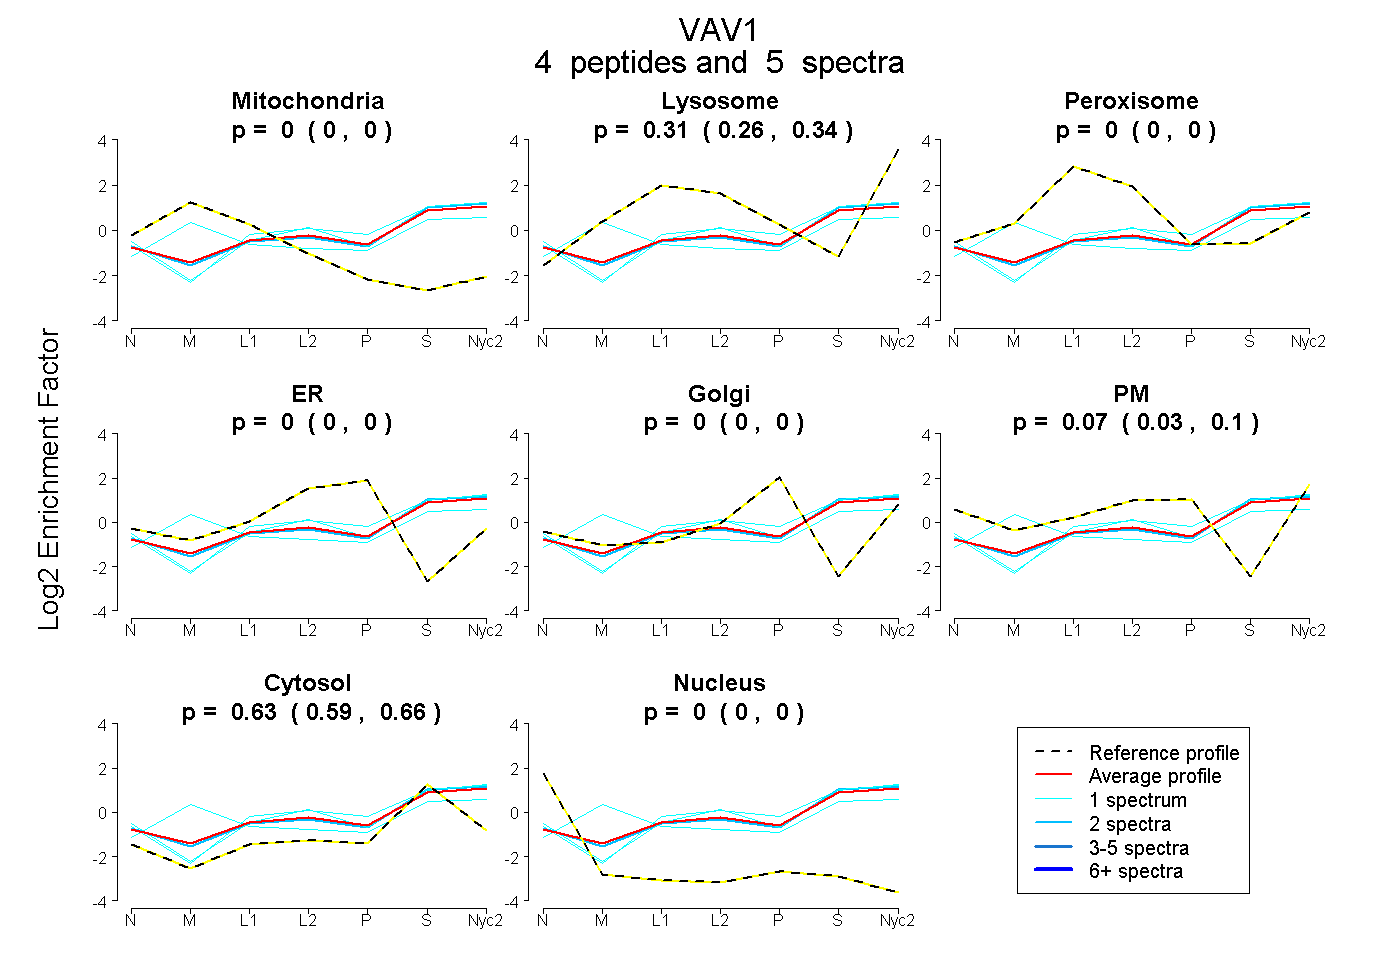
0.000 | 0.000
0.262 | 0.341
0.000 | 0.000
0.000 | 0.000
0.000 | 0.000
0.030 | 0.096
0.594 | 0.655
0.000 | 0.000
| Plot | Mito | Lyso | Perox | ER | Golgi | PM | Cytosol | Nucleus | |||||
| Expt A |
4 peptides |
5 spectra |
|
0.000 0.000 | 0.000 |
0.306 0.262 | 0.341 |
0.000 0.000 | 0.000 |
0.000 0.000 | 0.000 |
0.000 0.000 | 0.000 |
0.066 0.030 | 0.096 |
0.627 0.594 | 0.655 |
0.000 0.000 | 0.000 |
| 1 spectrum, AGAEGILTNR | 0.000 | 0.304 | 0.000 | 0.000 | 0.000 | 0.083 | 0.613 | 0.000 | ||
| 2 spectra, FLVYGR | 0.000 | 0.312 | 0.000 | 0.000 | 0.000 | 0.040 | 0.648 | 0.000 | ||
| 1 spectrum, YAFLLDK | 0.000 | 0.285 | 0.000 | 0.000 | 0.000 | 0.070 | 0.645 | 0.000 | ||
| 1 spectrum, GQQGWWR | 0.208 | 0.306 | 0.000 | 0.000 | 0.000 | 0.000 | 0.485 | 0.000 |
| Plot | Lyso | Other | |||||||||||
| Expt C |
9 peptides |
19 spectra |
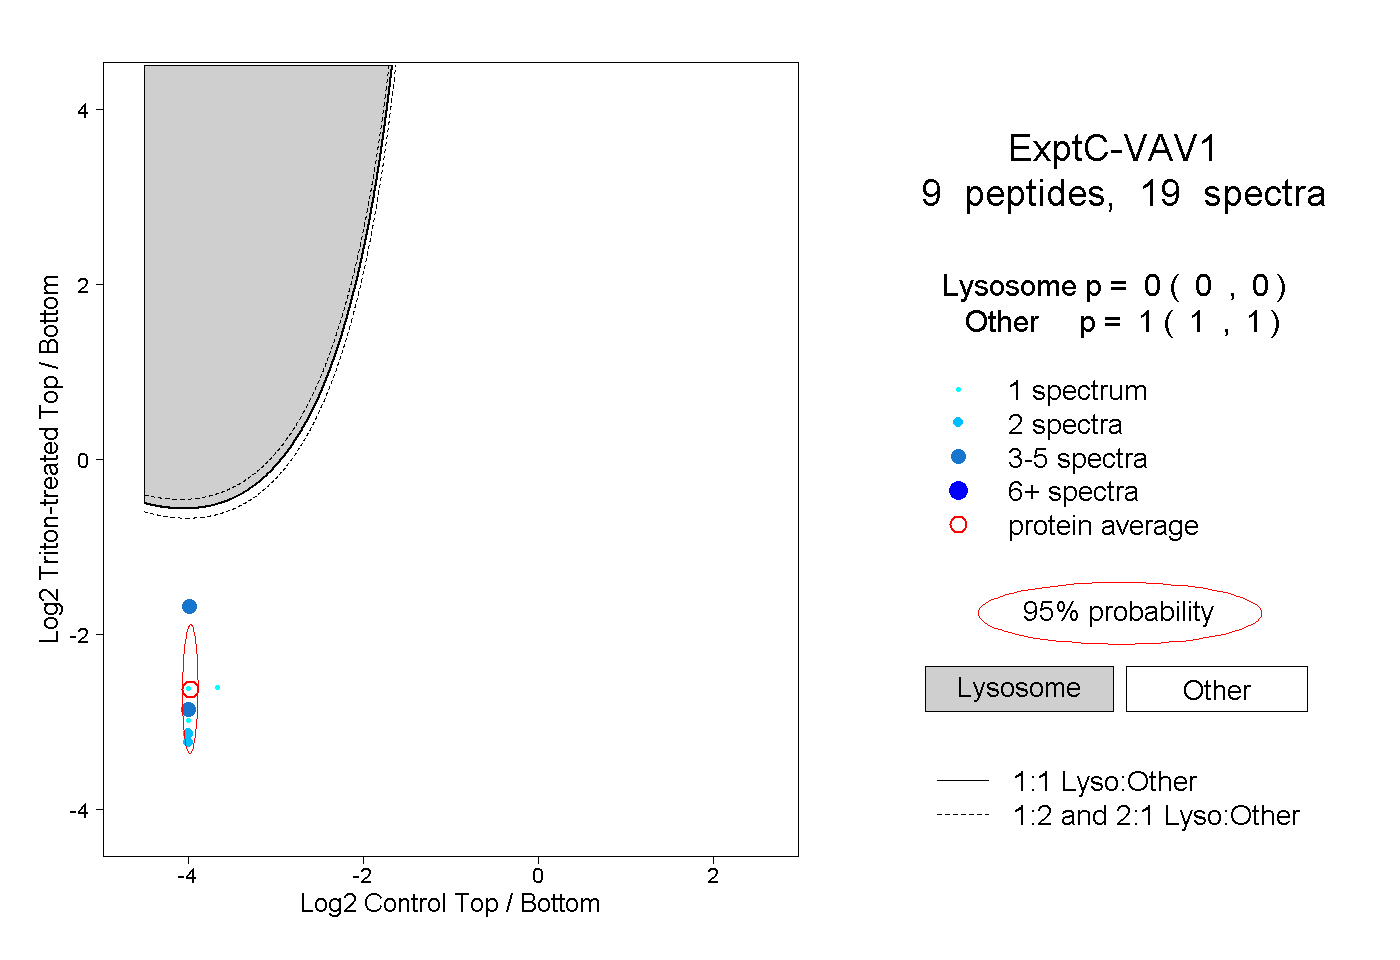 |
0.000 0.000 | 0.000 |
1.000 1.000 | 1.000 |