 2
2peptides
spectra
NA | NA
NA | NA
NA | NA
NA | NA
NA | NA
NA | NA
NA | NA
NA | NA
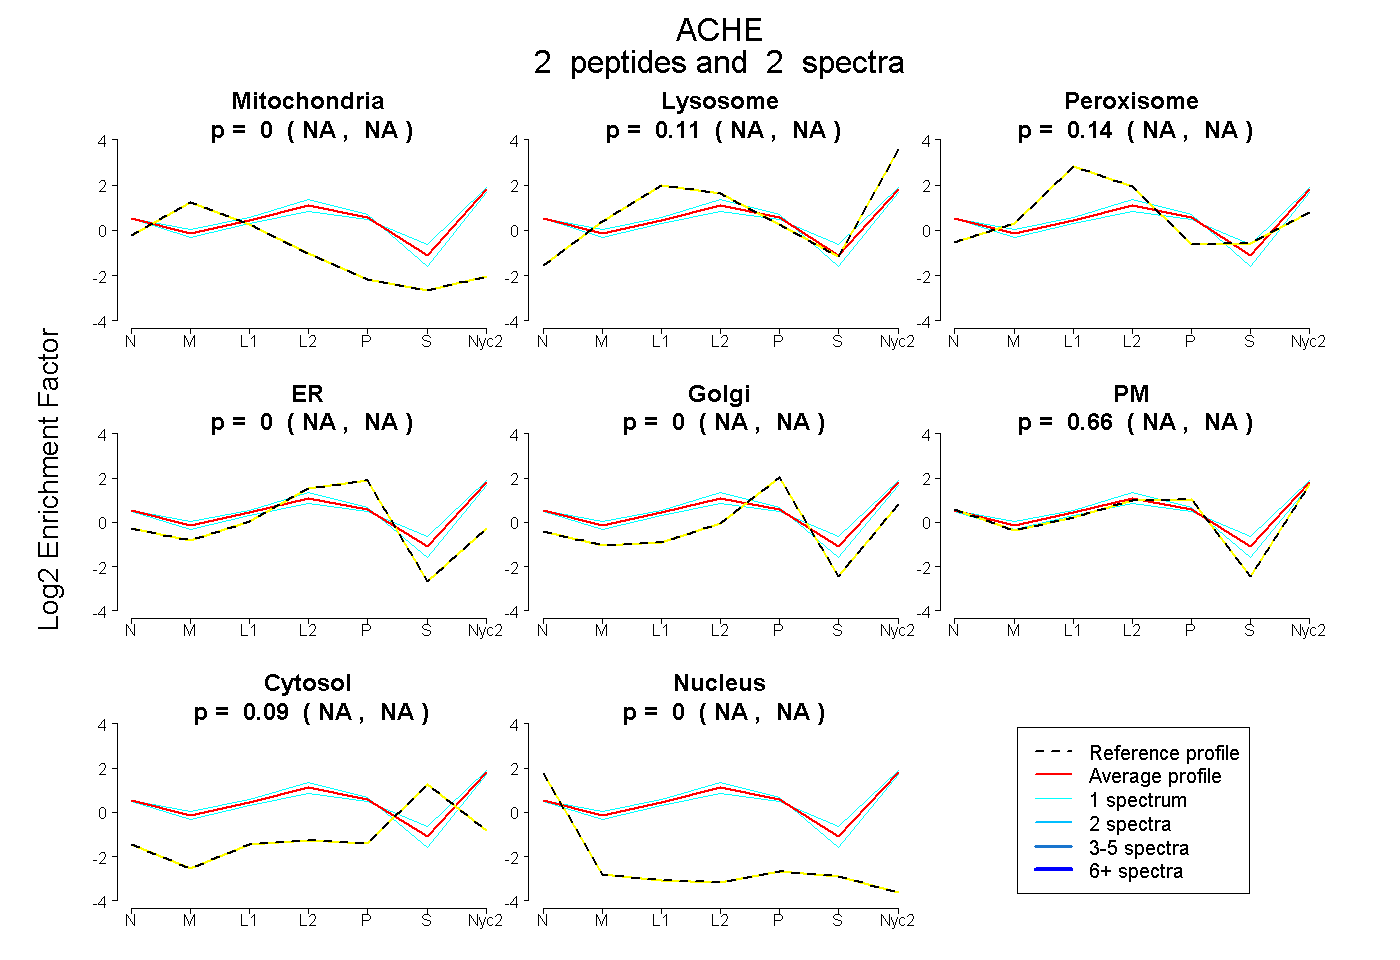
| Plot | Mito | Lyso | Perox | ER | Golgi | PM | Cytosol | Nucleus | |||||
| Expt A |
2 peptides |
2 spectra |
|
0.000 NA | NA |
0.115 NA | NA |
0.140 NA | NA |
0.000 NA | NA |
0.000 NA | NA |
0.656 NA | NA |
0.089 NA | NA |
0.000 NA | NA |
| 1 spectrum, YWTNFAR | 0.000 | 0.186 | 0.078 | 0.000 | 0.000 | 0.567 | 0.169 | 0.000 | ||
| 1 spectrum, VGTFGFLALPGSR | 0.000 | 0.044 | 0.202 | 0.000 | 0.000 | 0.745 | 0.009 | 0.000 |