 1
1peptide
spectra
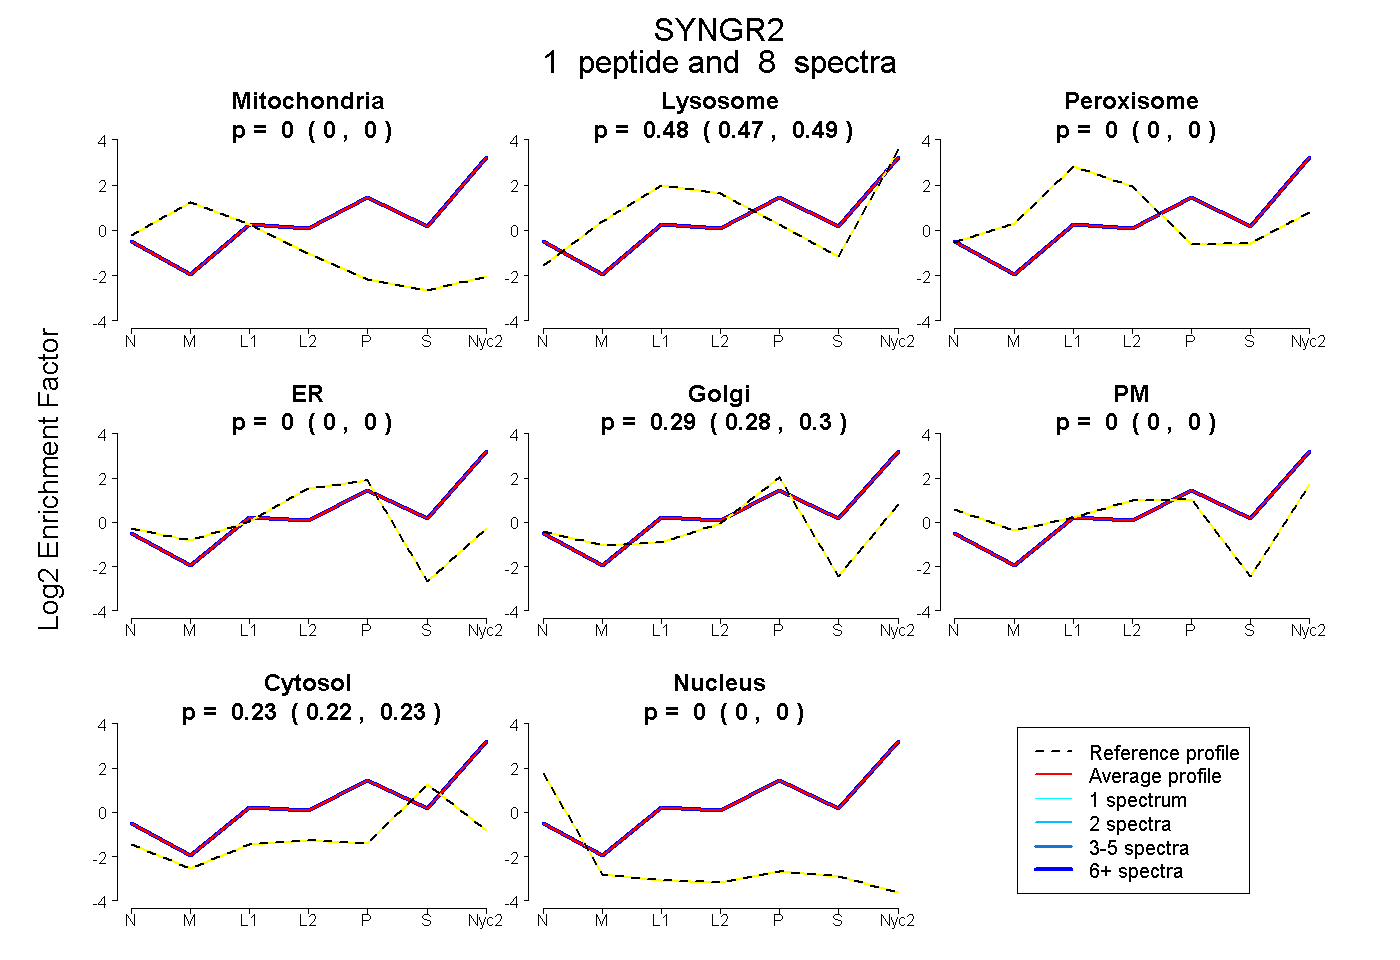
0.000 | 0.000
0.475 | 0.487
0.000 | 0.000
0.000 | 0.000
0.281 | 0.299
0.000 | 0.000
0.222 | 0.233
0.000 | 0.000
1peptide
spectra
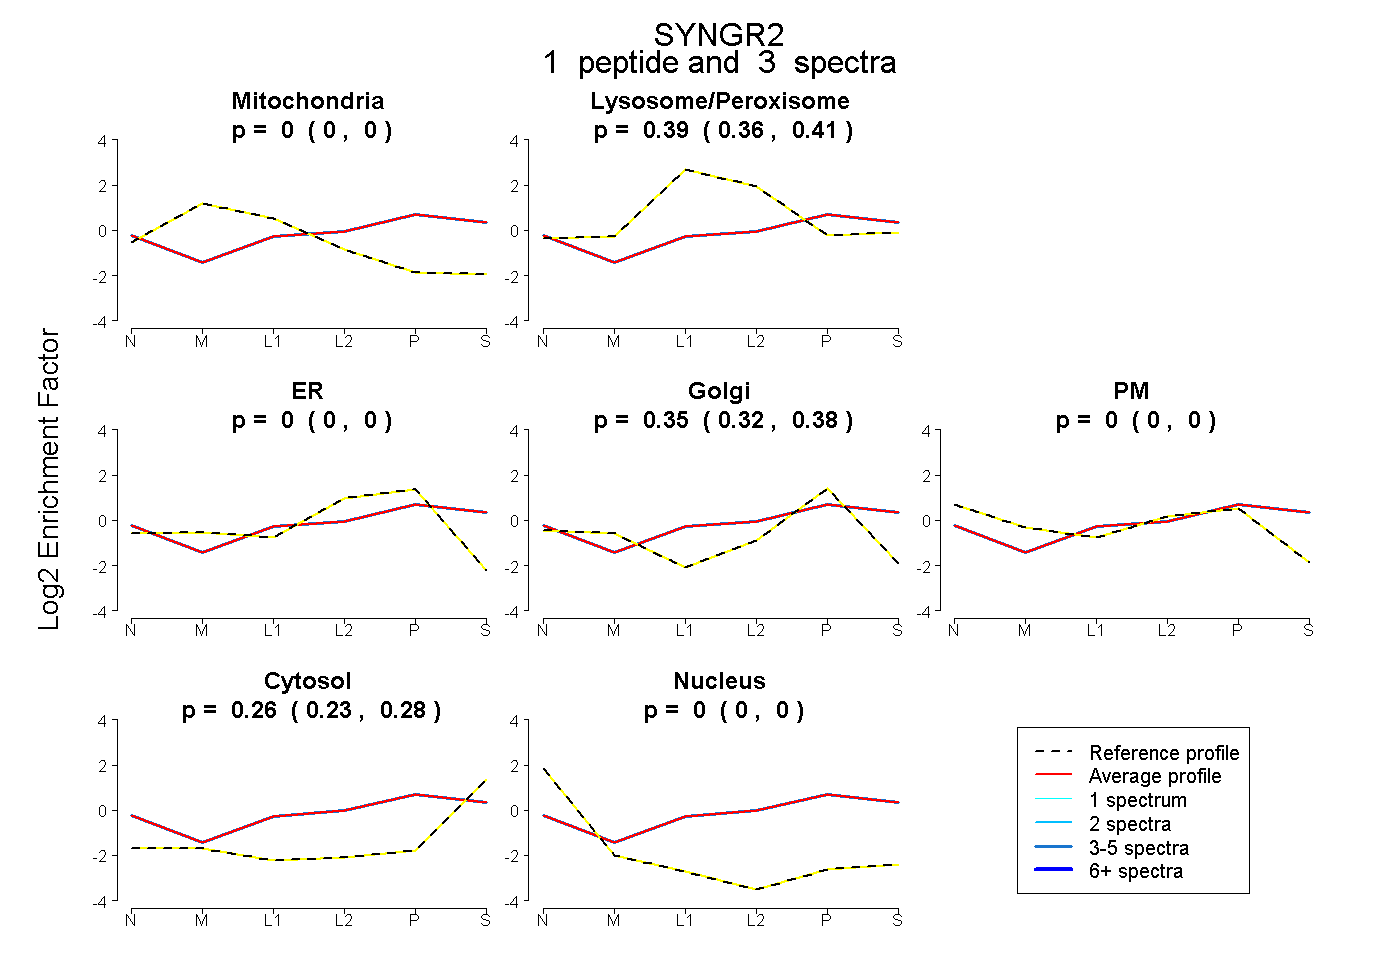
0.000 | 0.000
0.364 | 0.410
0.000 | 0.000
0.325 | 0.377
0.000 | 0.000
0.231 | 0.280
0.000 | 0.000
1peptide
spectra
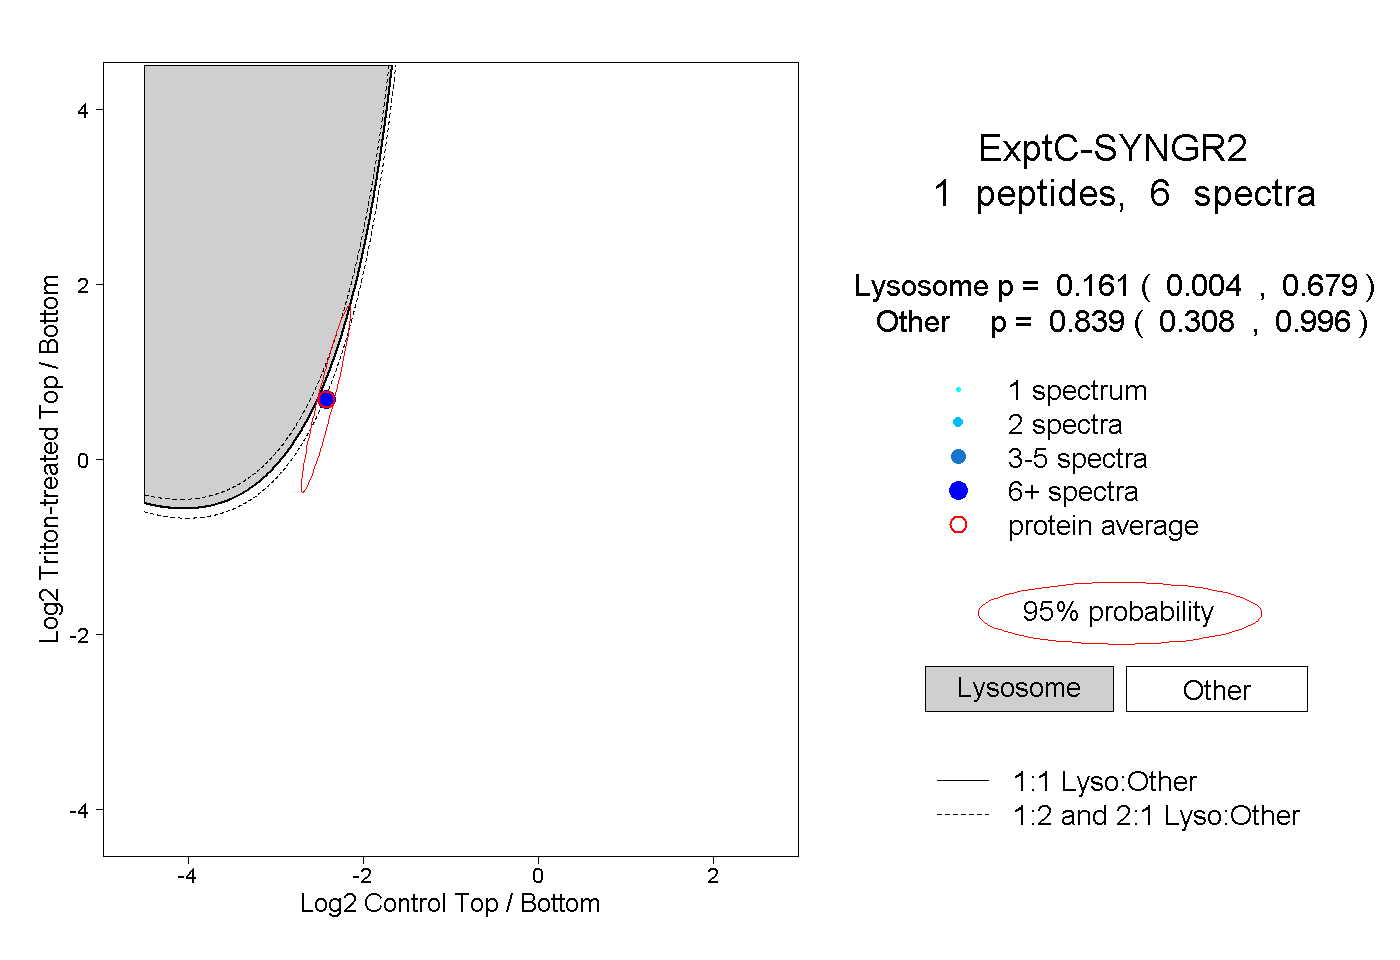
0.004 | 0.679
0.308 | 0.996
1peptide
spectra
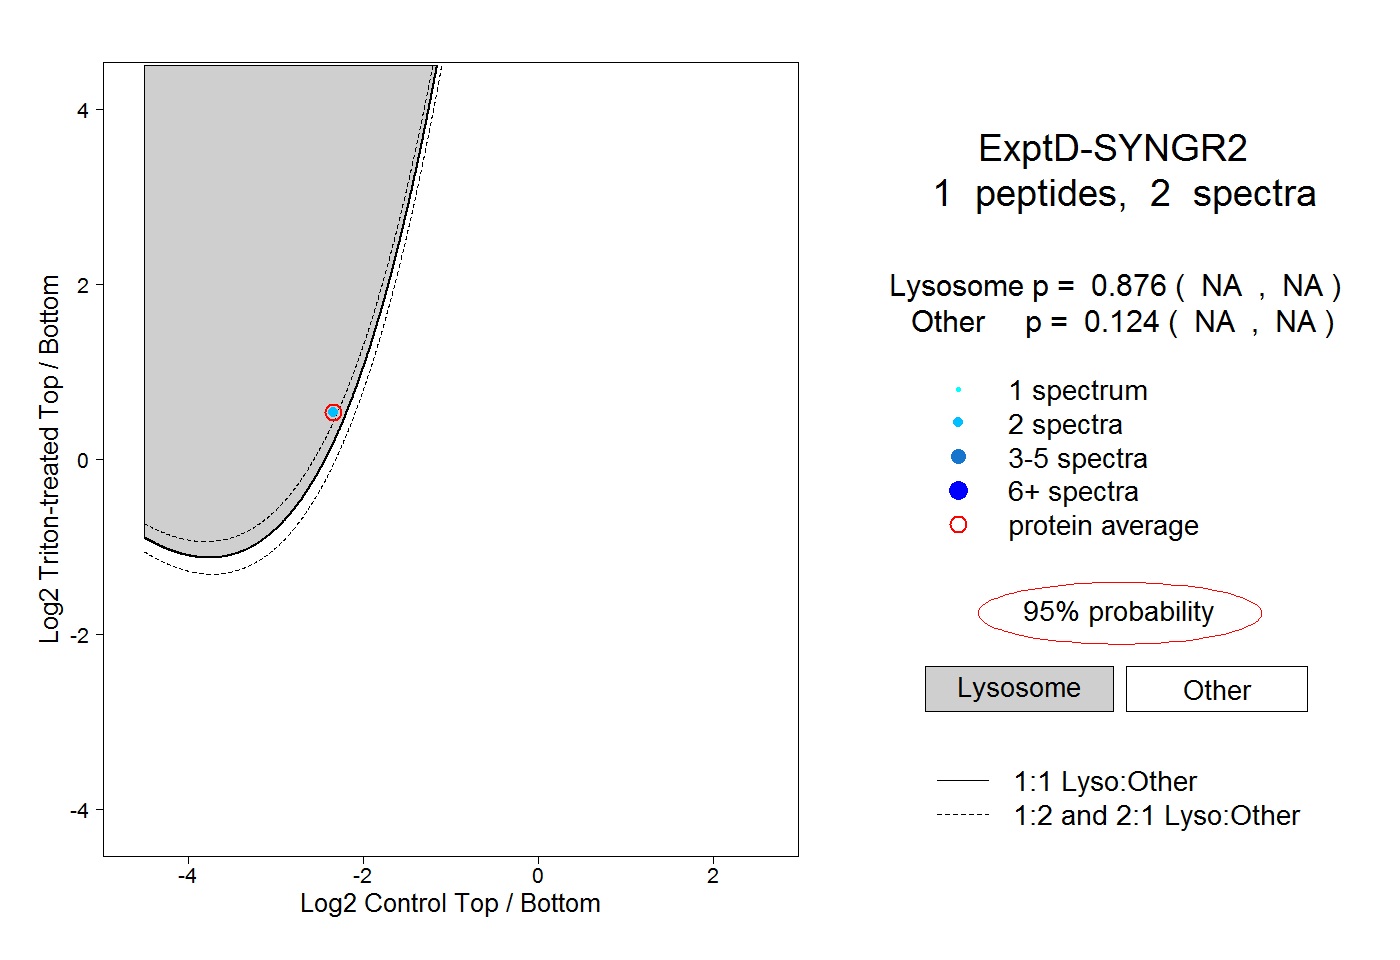
NA | NA
NA | NA