 5
5peptides
spectra
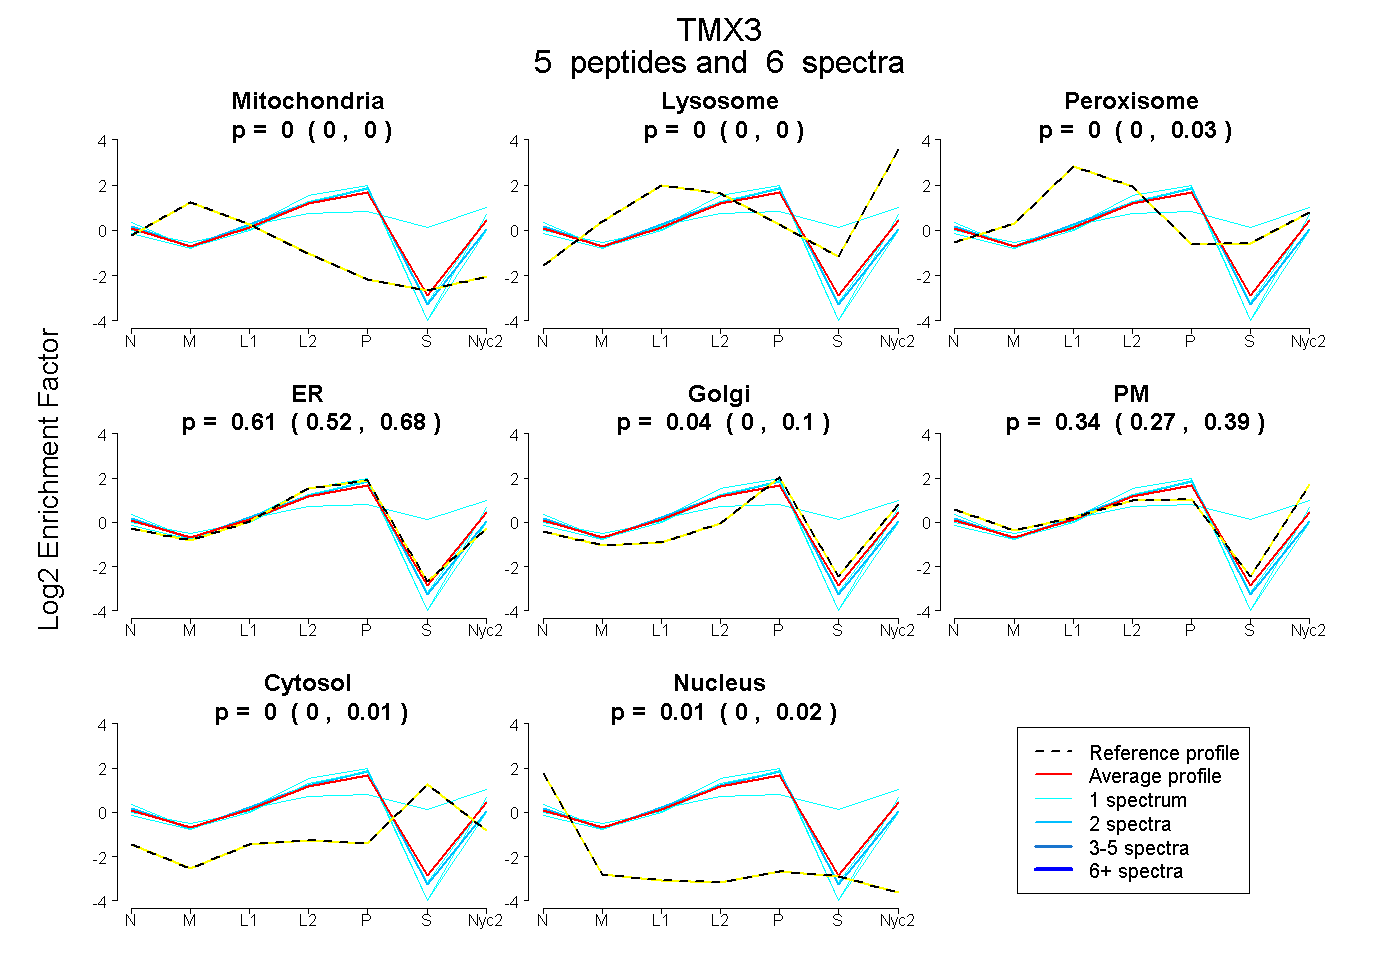
0.000 | 0.004
0.000 | 0.000
0.000 | 0.026
0.518 | 0.675
0.000 | 0.105
0.266 | 0.388
0.000 | 0.008
0.000 | 0.020
1peptide
spectrum
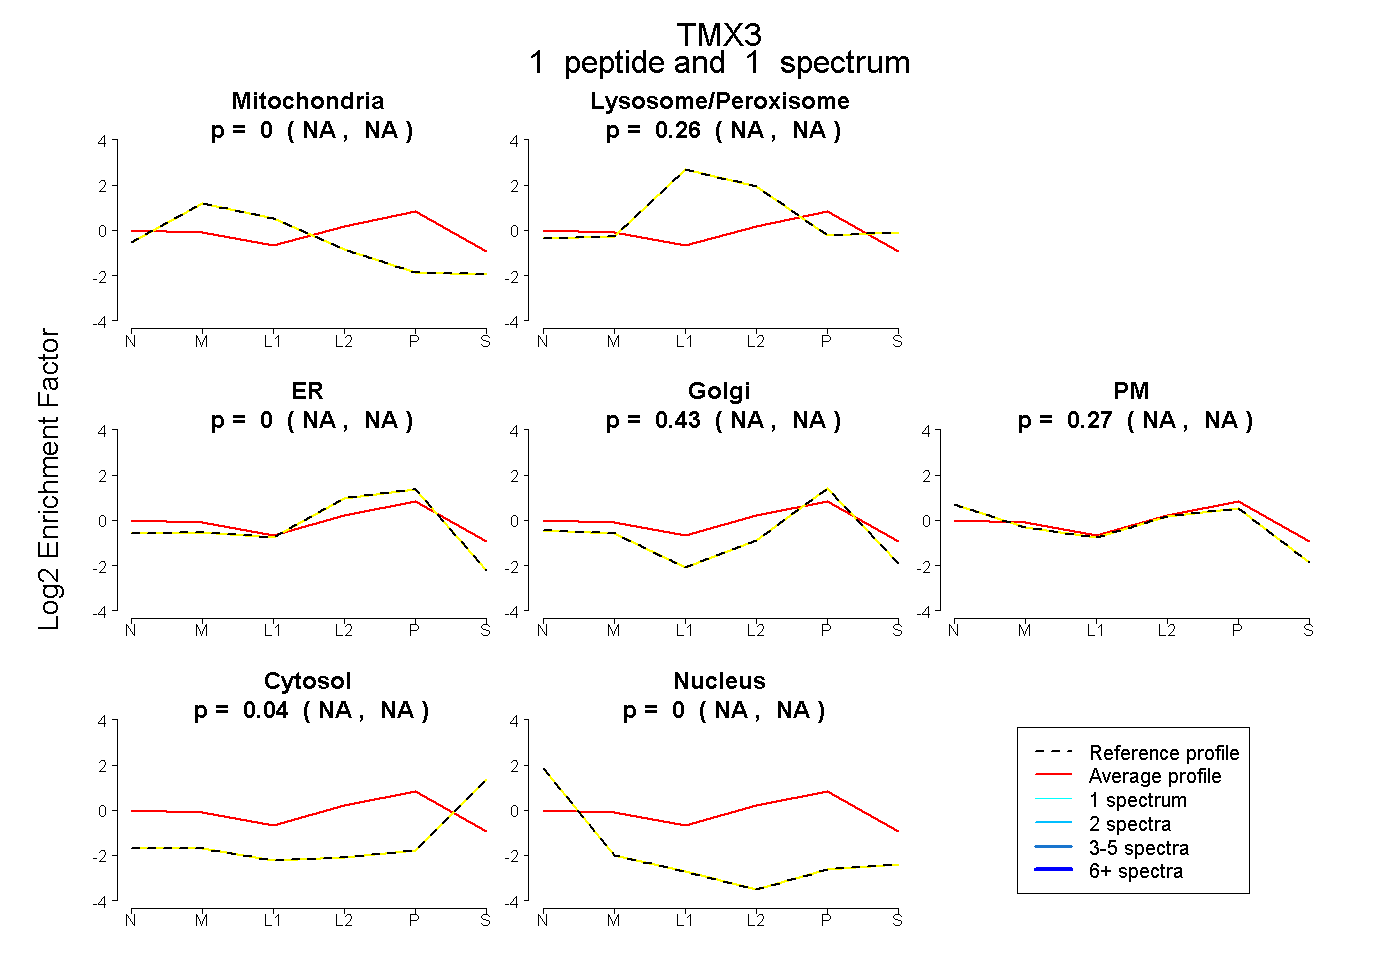
NA | NA
NA | NA
NA | NA
NA | NA
NA | NA
NA | NA
NA | NA
5peptides
spectra
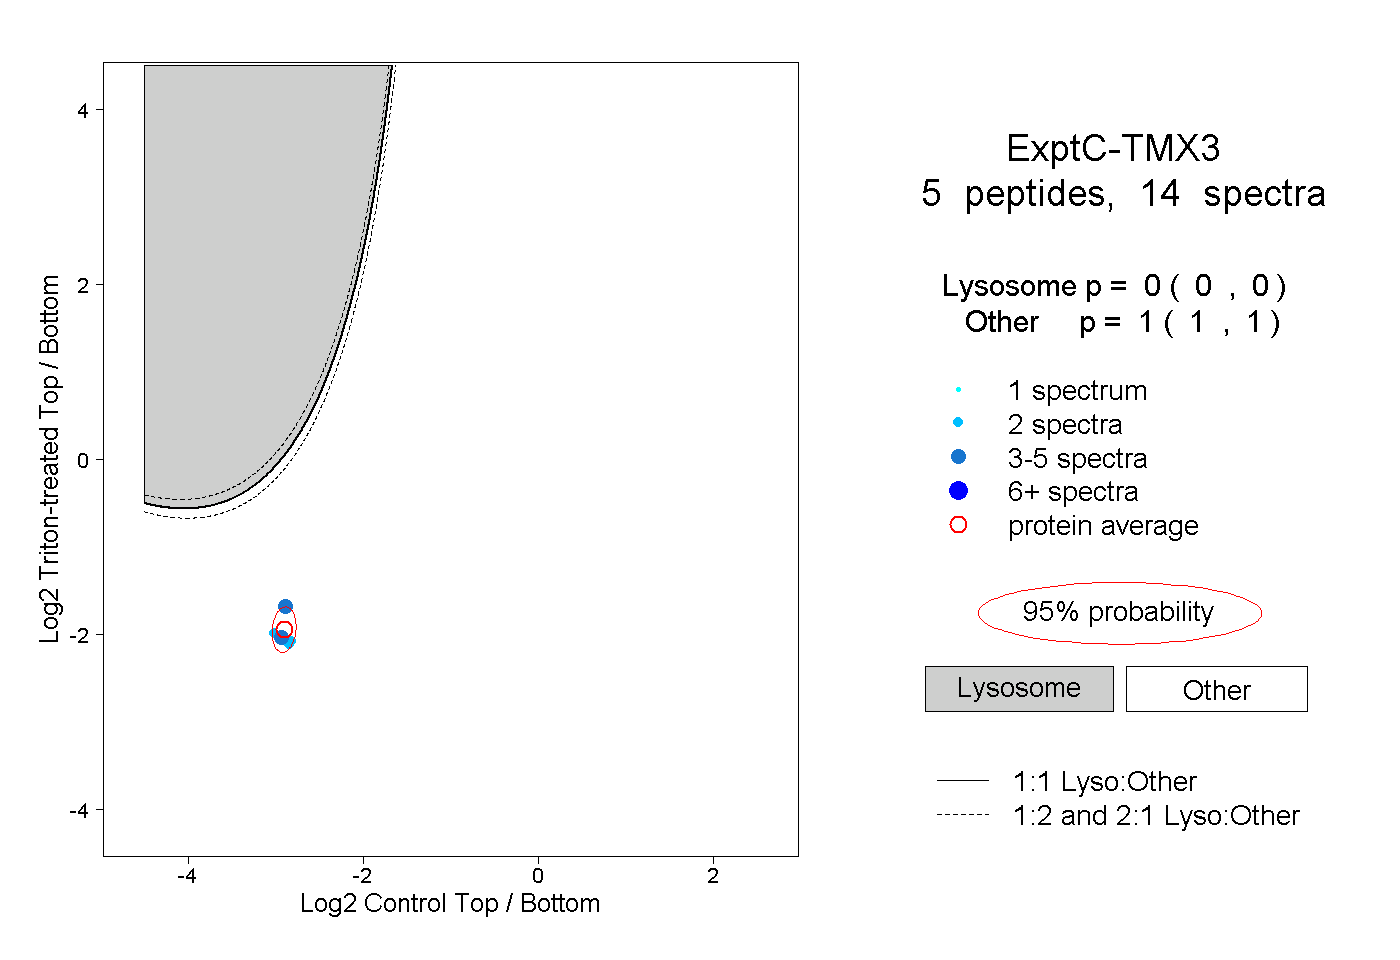
0.000 | 0.000
1.000 | 1.000
2peptides
spectra
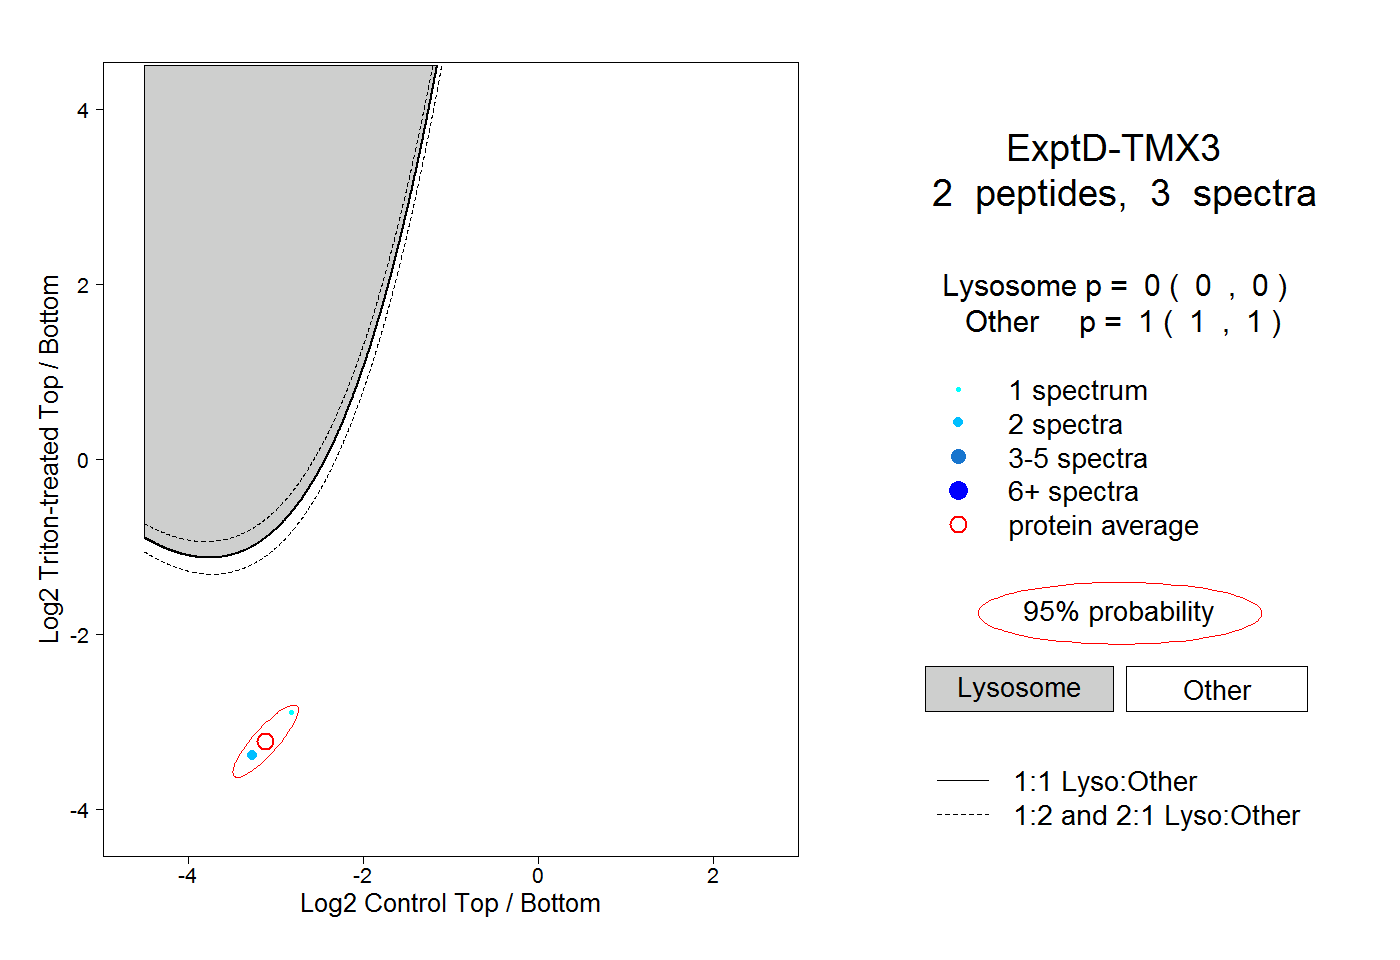
0.000 | 0.000
1.000 | 1.000