 3
3peptides
spectra
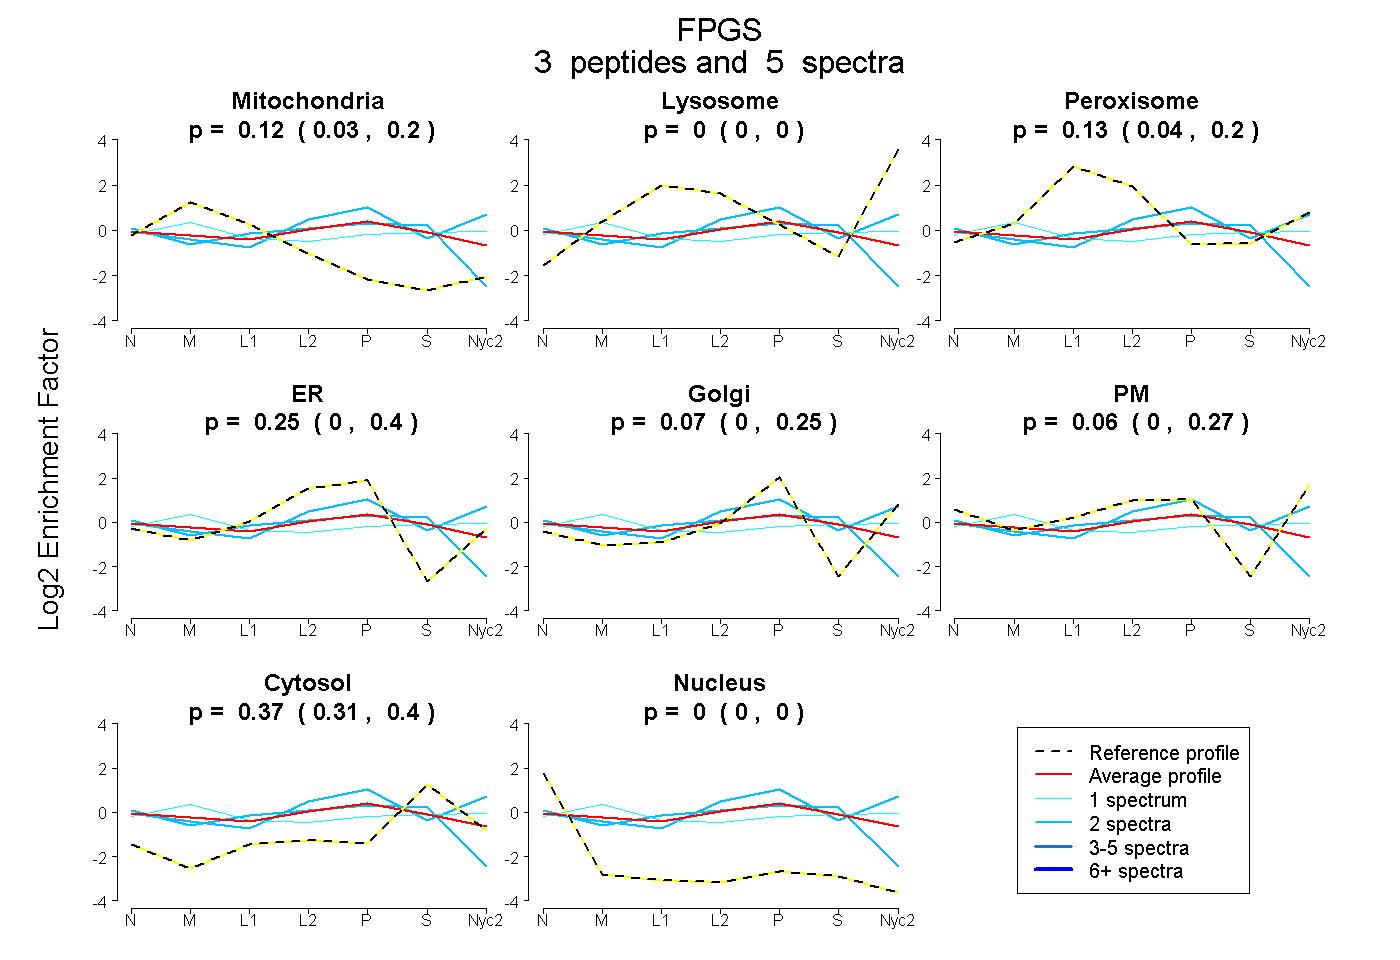
0.033 | 0.204
0.000 | 0.000
0.040 | 0.196
0.000 | 0.397
0.000 | 0.246
0.000 | 0.269
0.309 | 0.404
0.000 | 0.000
1peptide
spectrum
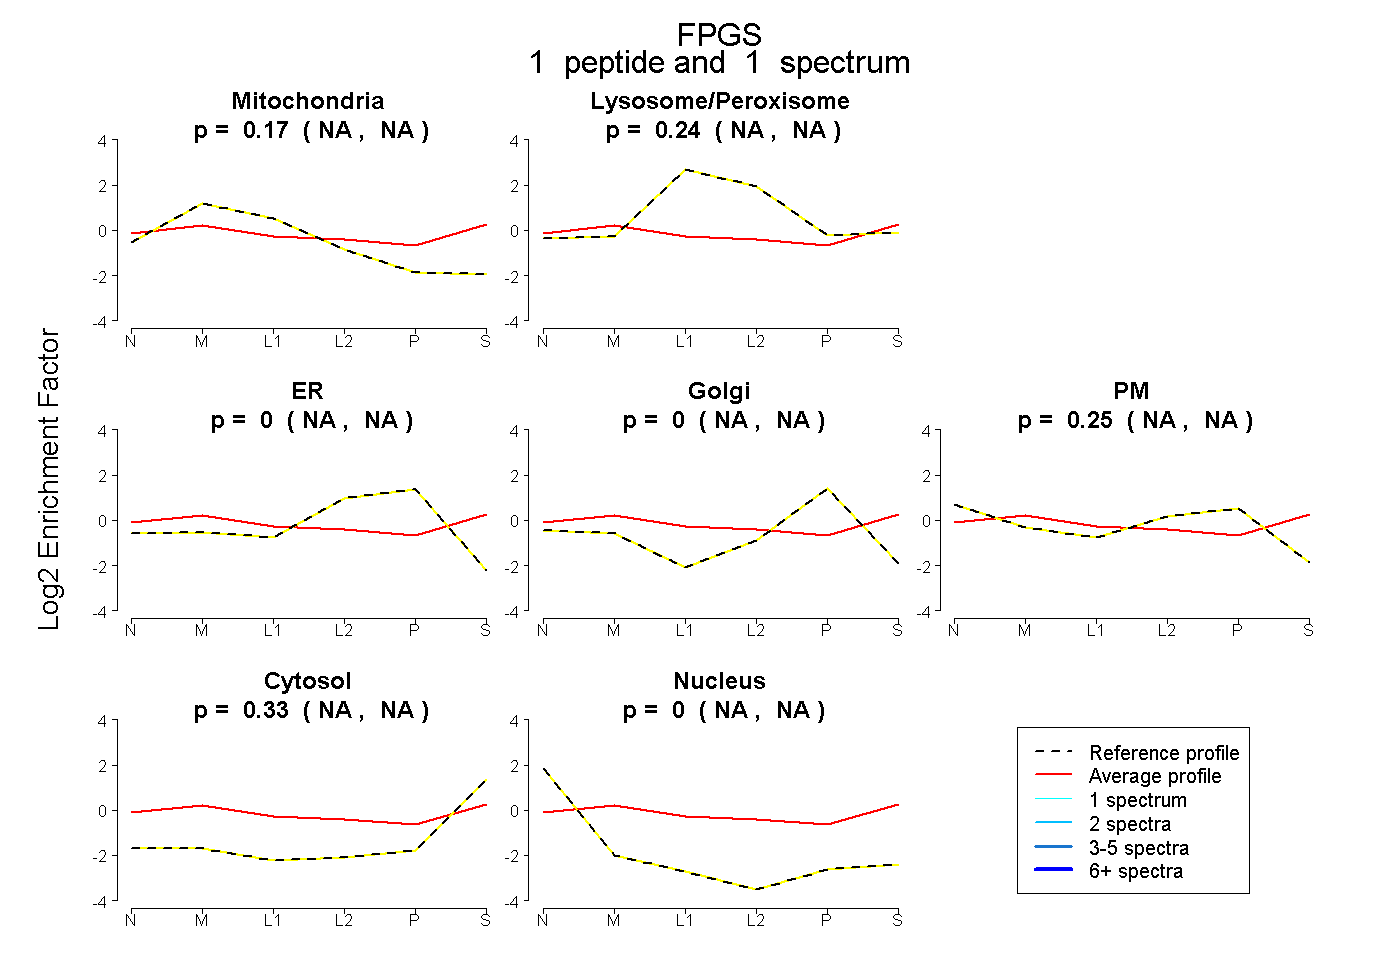
NA | NA
NA | NA
NA | NA
NA | NA
NA | NA
NA | NA
NA | NA
4peptides
spectra
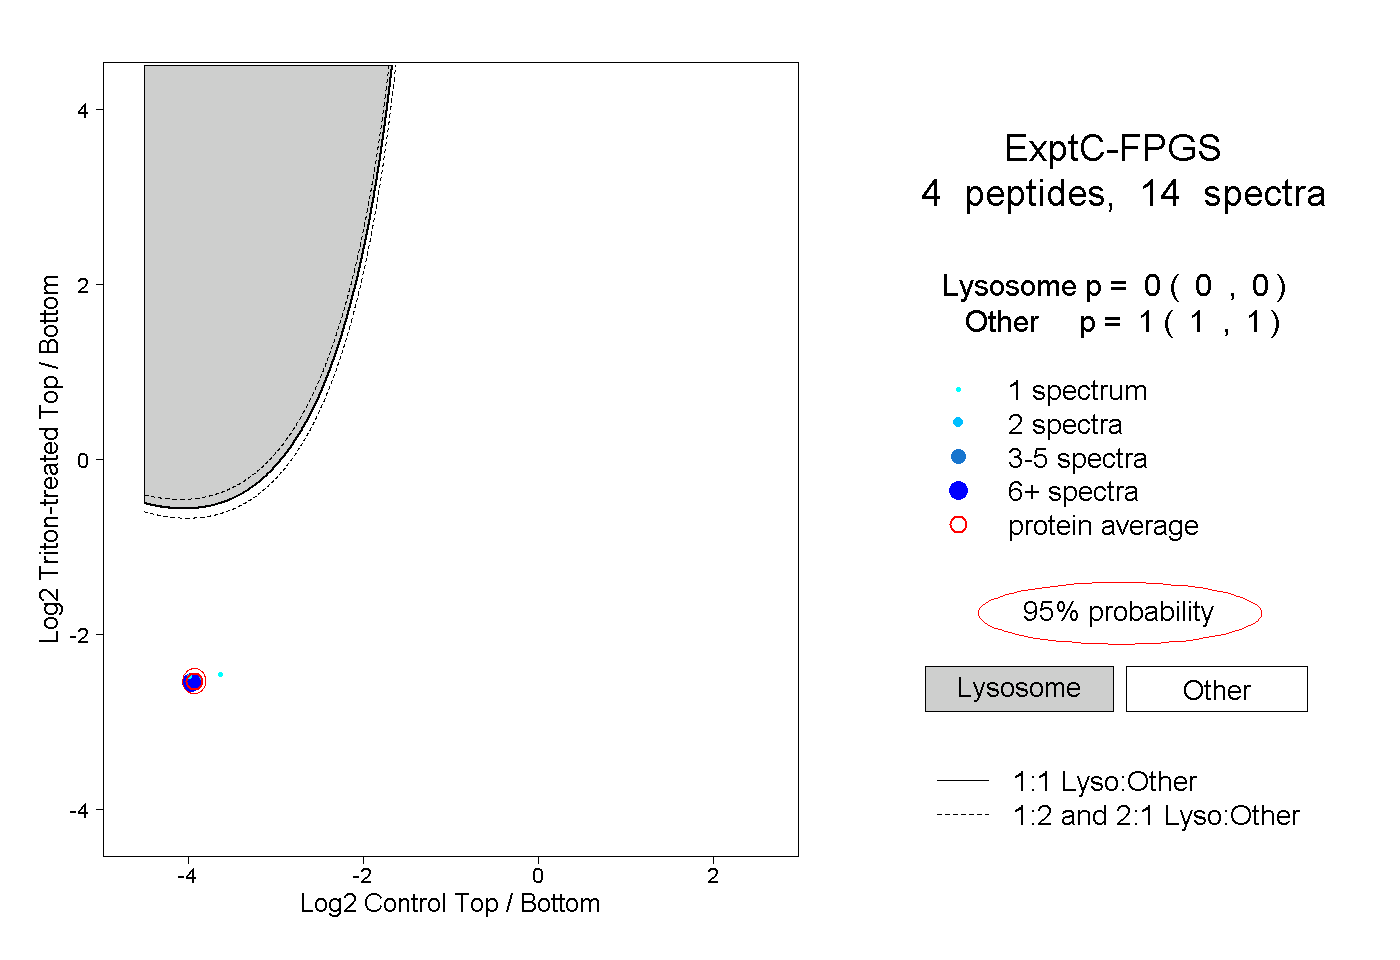
0.000 | 0.000
1.000 | 1.000
1peptide
spectrum
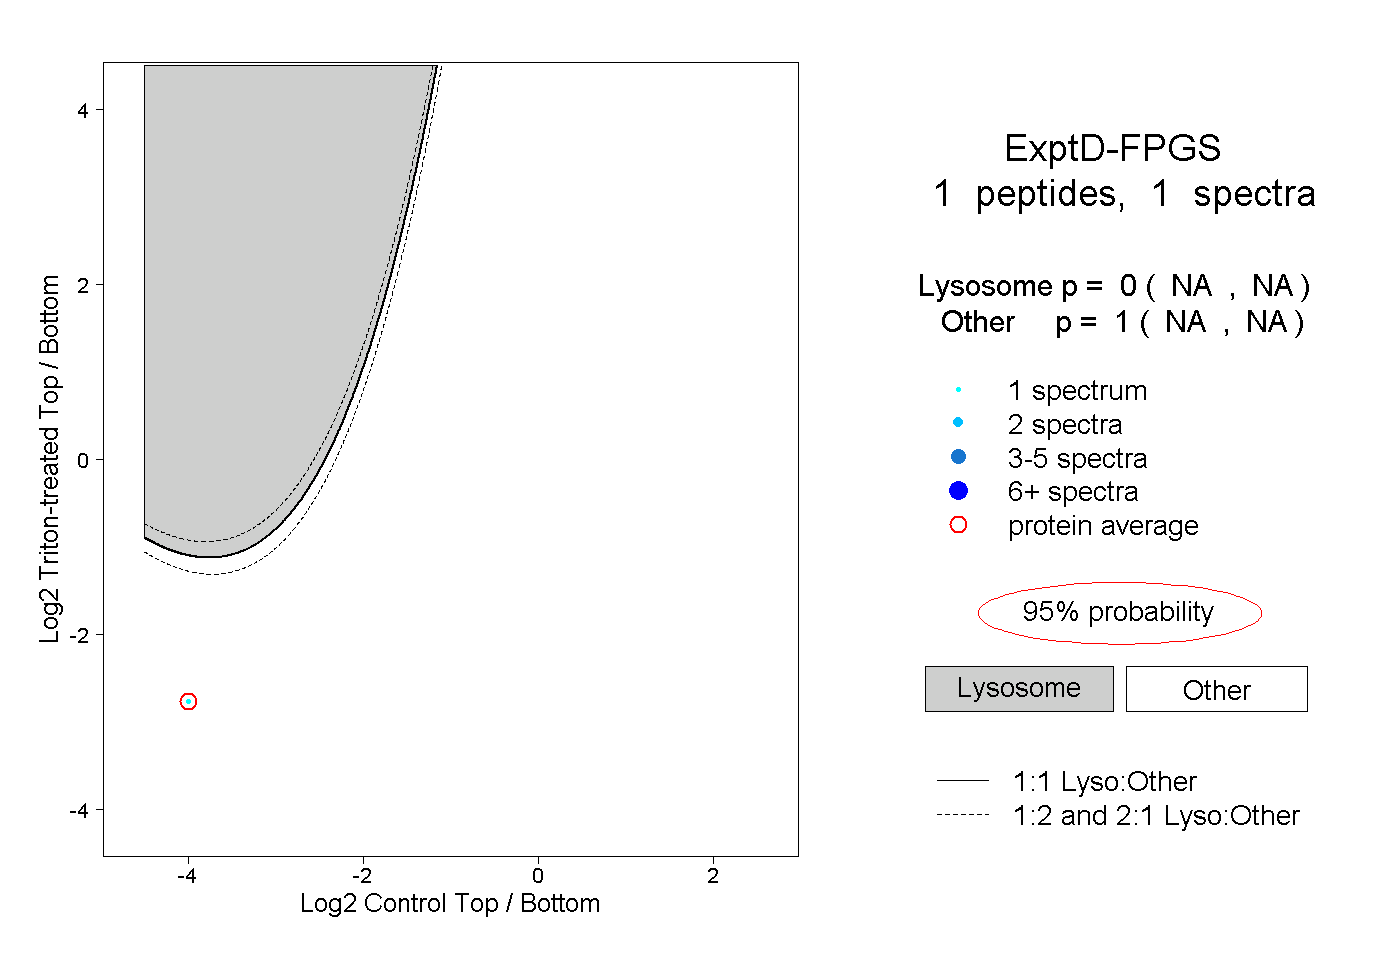
NA | NA
NA | NA