 14
14peptides
spectra
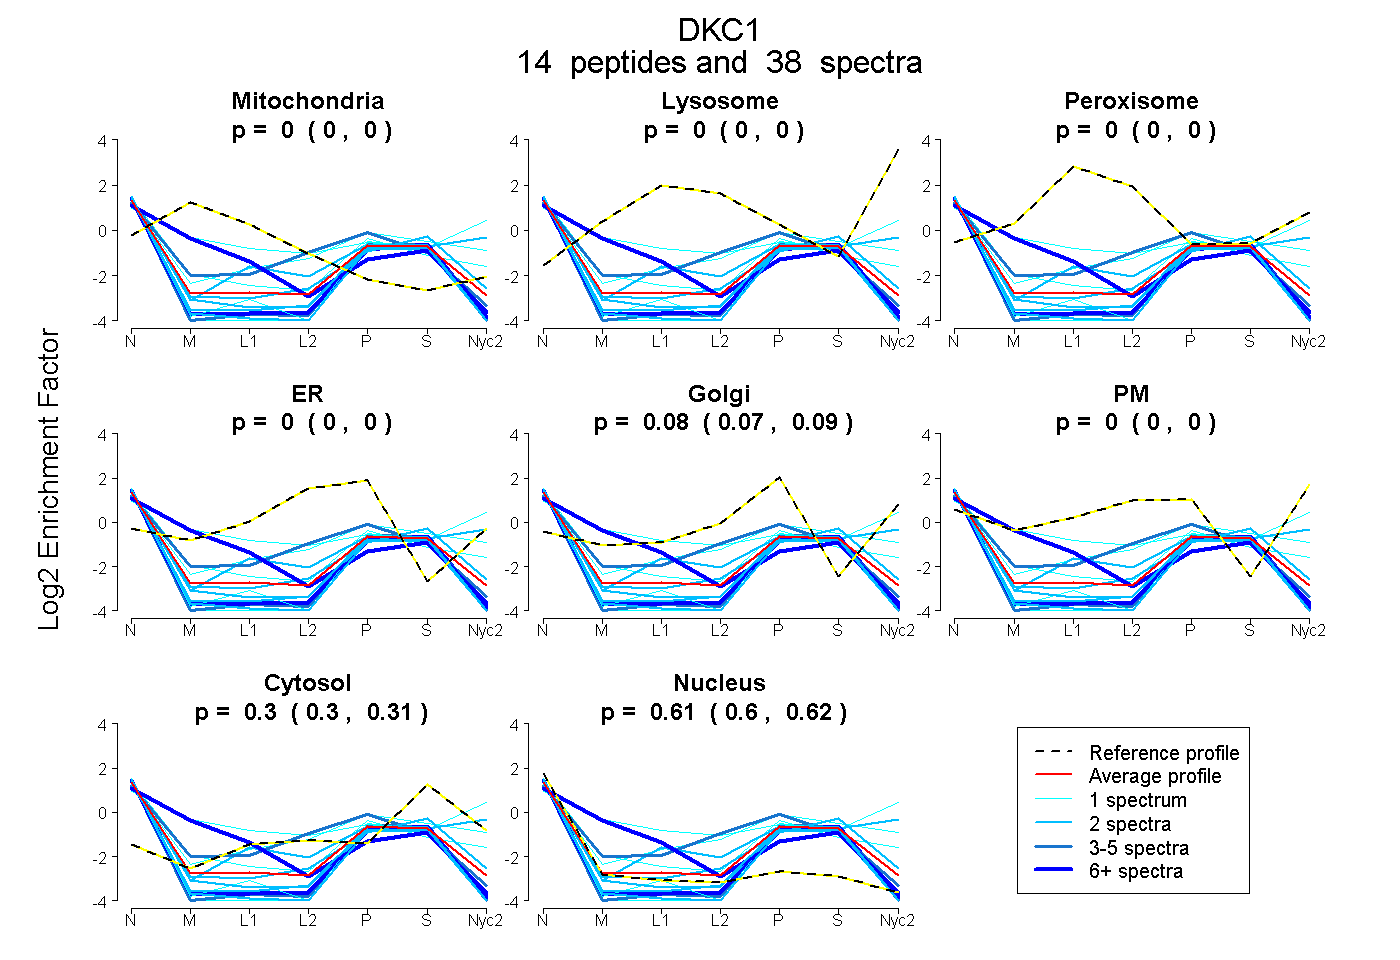
0.000 | 0.000
0.000 | 0.000
0.000 | 0.000
0.000 | 0.000
0.071 | 0.091
0.000 | 0.000
0.298 | 0.309
0.602 | 0.624
5peptides
spectra

0.000 | 0.000
0.000 | 0.073
0.000 | 0.000
0.000 | 0.096
0.000 | 0.190
0.128 | 0.205
0.617 | 0.703