 14
14peptides
spectra
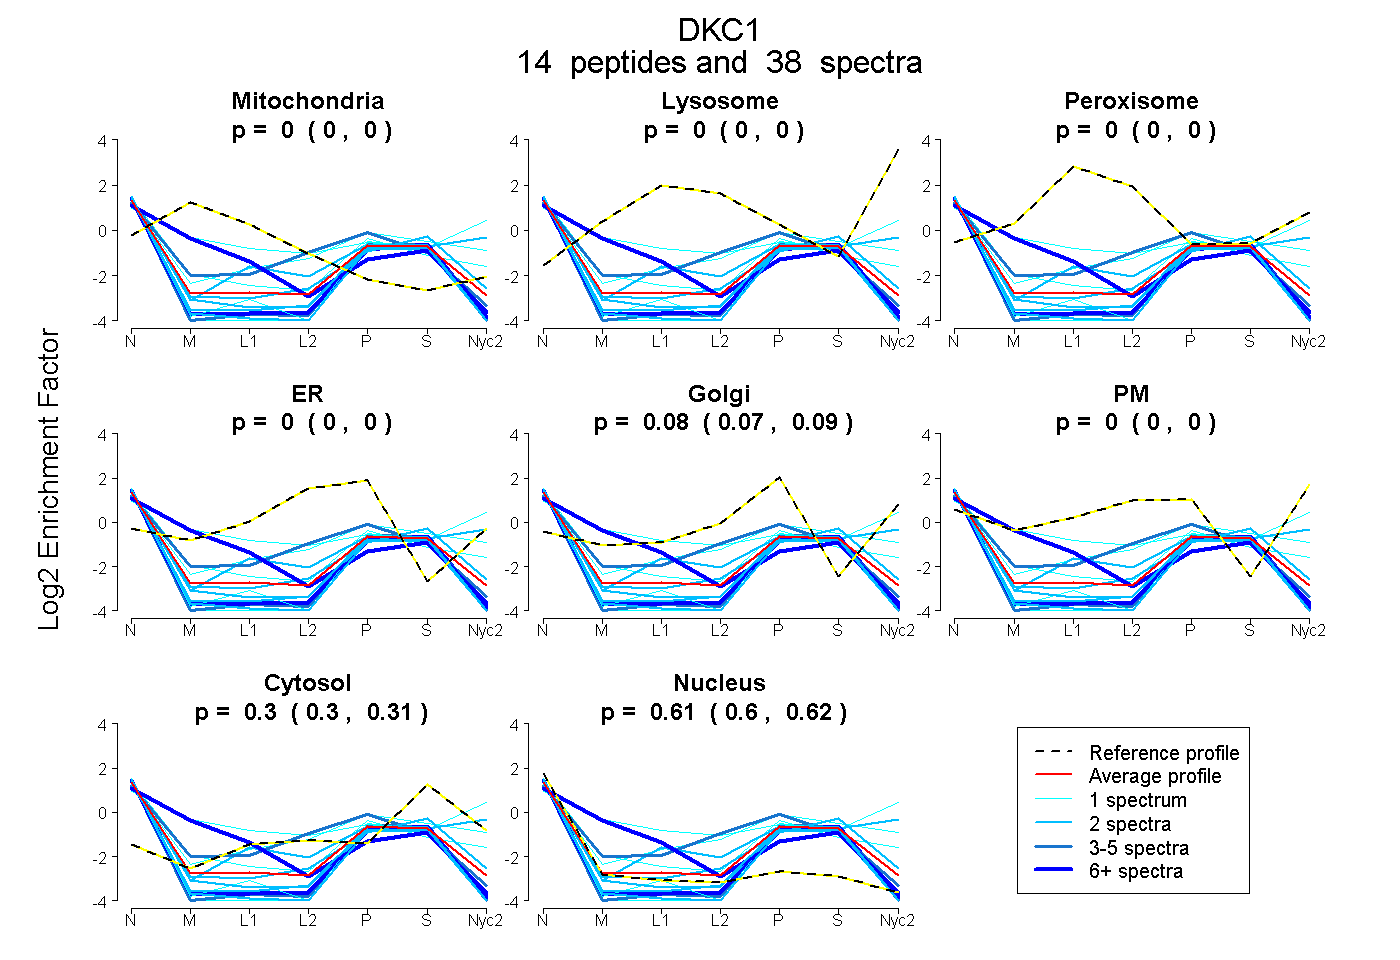
0.000 | 0.000
0.000 | 0.000
0.000 | 0.000
0.000 | 0.000
0.071 | 0.091
0.000 | 0.000
0.298 | 0.309
0.602 | 0.624
| Plot | Mito | Lyso | Perox | ER | Golgi | PM | Cytosol | Nucleus | |||||
| Expt A |
14 peptides |
38 spectra |
|
0.000 0.000 | 0.000 |
0.000 0.000 | 0.000 |
0.000 0.000 | 0.000 |
0.000 0.000 | 0.000 |
0.082 0.071 | 0.091 |
0.000 0.000 | 0.000 |
0.304 0.298 | 0.309 |
0.614 0.602 | 0.624 |
| 2 spectra, VVFPLEK | 0.000 | 0.000 | 0.000 | 0.000 | 0.000 | 0.000 | 0.183 | 0.817 | ||
| 1 spectrum, LLTSHK | 0.000 | 0.000 | 0.000 | 0.000 | 0.000 | 0.000 | 0.226 | 0.774 | ||
| 1 spectrum, AAEELSG | 0.000 | 0.000 | 0.000 | 0.000 | 0.284 | 0.000 | 0.202 | 0.514 | ||
| 10 spectra, IMLPGLLR | 0.000 | 0.000 | 0.000 | 0.000 | 0.000 | 0.000 | 0.234 | 0.766 | ||
| 2 spectra, VVEYDPER | 0.000 | 0.000 | 0.000 | 0.000 | 0.000 | 0.000 | 0.243 | 0.757 | ||
| 7 spectra, TIYESR | 0.380 | 0.000 | 0.000 | 0.000 | 0.000 | 0.000 | 0.167 | 0.453 | ||
| 1 spectrum, ATAAEATPGPGVTADAASIVK | 0.000 | 0.000 | 0.000 | 0.000 | 0.000 | 0.000 | 0.174 | 0.826 | ||
| 2 spectra, HGRPTDGTPASWTR | 0.000 | 0.000 | 0.000 | 0.000 | 0.026 | 0.246 | 0.368 | 0.360 | ||
| 1 spectrum, EYVGVVR | 0.000 | 0.000 | 0.000 | 0.000 | 0.150 | 0.196 | 0.359 | 0.295 | ||
| 3 spectra, DYVDYSDSSK | 0.000 | 0.000 | 0.000 | 0.000 | 0.000 | 0.000 | 0.220 | 0.780 | ||
| 2 spectra, TGHSGTLDPK | 0.000 | 0.000 | 0.000 | 0.000 | 0.023 | 0.000 | 0.417 | 0.560 | ||
| 1 spectrum, EIGEYVR | 0.129 | 0.000 | 0.000 | 0.000 | 0.000 | 0.479 | 0.282 | 0.110 | ||
| 3 spectra, LHNAIEGTAQLSR | 0.000 | 0.000 | 0.000 | 0.312 | 0.000 | 0.000 | 0.193 | 0.495 | ||
| 2 spectra, SQQSAGK | 0.000 | 0.000 | 0.000 | 0.000 | 0.000 | 0.000 | 0.226 | 0.774 |
| Plot | Mito | Lyso or Perox | ER | Golgi | PM | Cytosol | Nucleus | ||||||
| Expt B |
5 peptides |
7 spectra |
 |
0.000 0.000 | 0.000 |
0.000 0.000 | 0.073 |
0.000 0.000 | 0.000 |
0.000 0.000 | 0.096 |
0.165 0.000 | 0.190 |
0.185 0.128 | 0.205 |
0.651 0.617 | 0.703 |