 16
16peptides
spectra
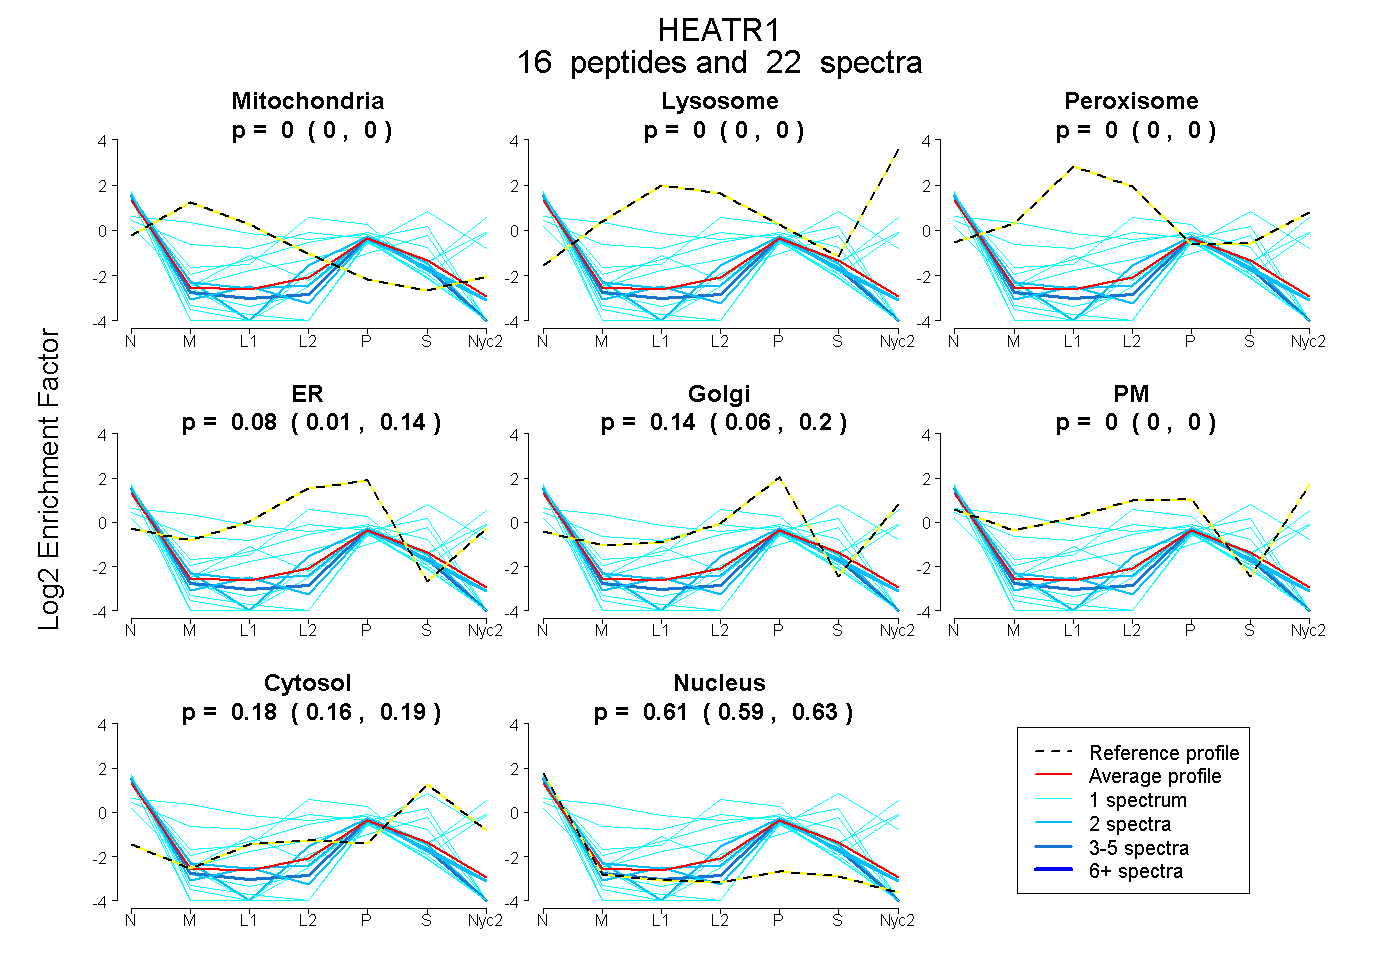
0.000 | 0.000
0.000 | 0.000
0.000 | 0.000
0.008 | 0.138
0.057 | 0.201
0.000 | 0.000
0.159 | 0.192
0.591 | 0.625
1peptide
spectrum
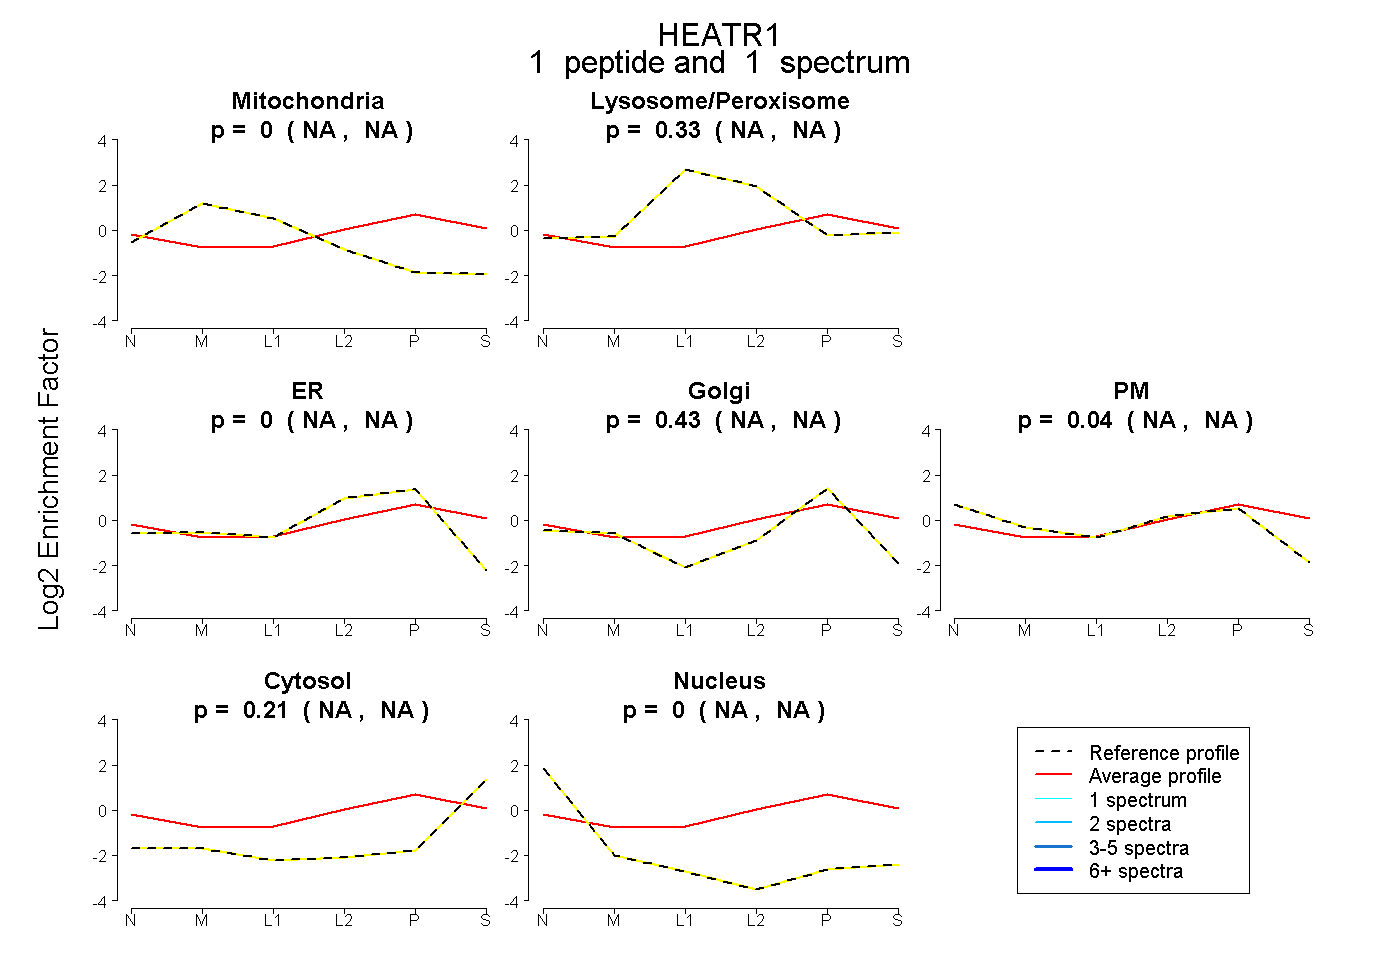
NA | NA
NA | NA
NA | NA
NA | NA
NA | NA
NA | NA
NA | NA
1peptide
spectra
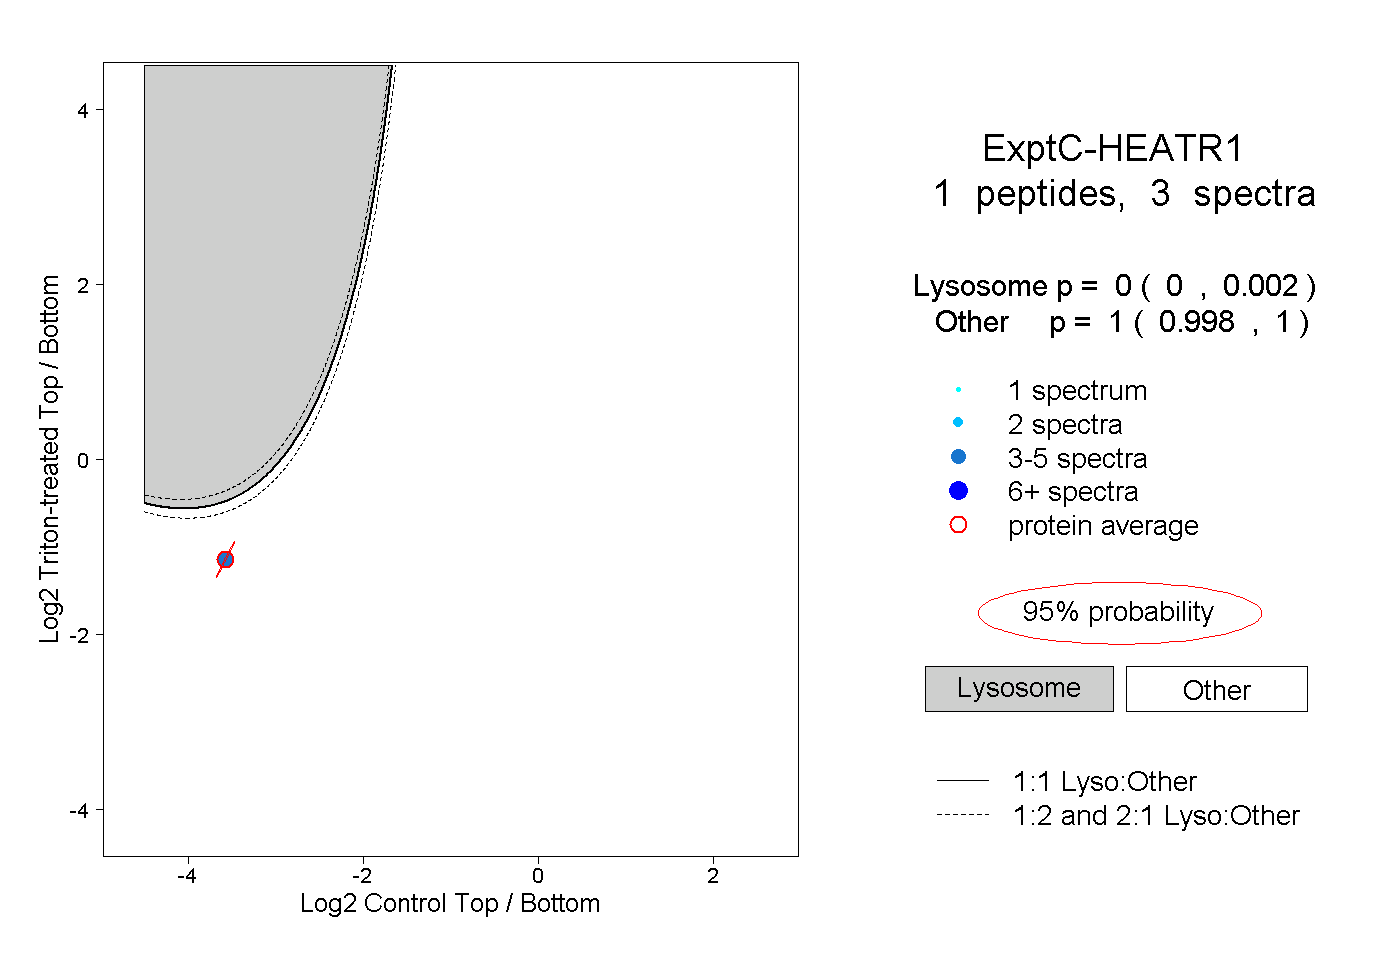
0.000 | 0.002
0.998 | 1.000