 3
3peptides
spectra

0.000 | 0.000
0.015 | 0.082
0.000 | 0.040
0.000 | 0.000
0.000 | 0.126
0.095 | 0.246
0.663 | 0.723
0.000 | 0.000
4peptides
spectra
0.000 | 0.000
1.000 | 1.000
| Plot | Mito | Lyso | Perox | ER | Golgi | PM | Cytosol | Nucleus | |||||
| Expt A |
3 peptides |
8 spectra |
|
0.000 0.000 | 0.000 |
0.057 0.015 | 0.082 |
0.000 0.000 | 0.040 |
0.000 0.000 | 0.000 |
0.029 0.000 | 0.126 |
0.210 0.095 | 0.246 |
0.703 0.663 | 0.723 |
0.000 0.000 | 0.000 |
||
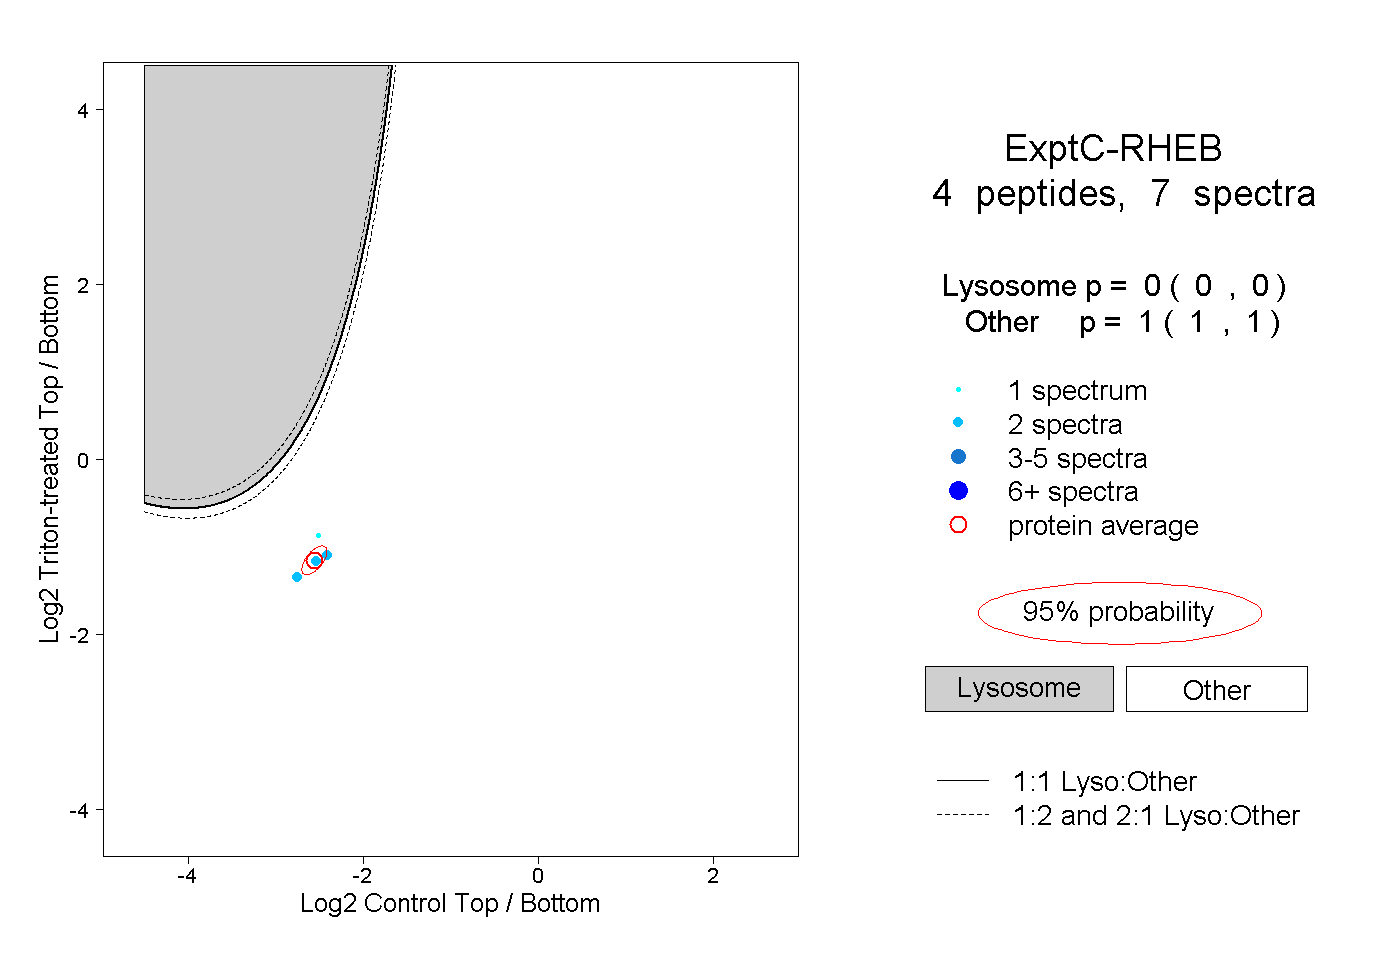
| Plot | Lyso | Other | |||||||||||
| Expt C |
4 peptides |
7 spectra |
|
0.000 0.000 | 0.000 |
1.000 1.000 | 1.000 |