 1
1peptide
spectrum

NA | NA
NA | NA
NA | NA
NA | NA
NA | NA
NA | NA
NA | NA
NA | NA
| Plot | Mito | Lyso | Perox | ER | Golgi | PM | Cytosol | Nucleus | |||||
| Expt A |
1 peptide |
1 spectrum |
|
0.423 NA | NA |
0.000 NA | NA |
0.318 NA | NA |
0.000 NA | NA |
0.067 NA | NA |
0.091 NA | NA |
0.101 NA | NA |
0.000 NA | NA |
| 1 spectrum, AQAFEAIK | 0.423 | 0.000 | 0.318 | 0.000 | 0.067 | 0.091 | 0.101 | 0.000 |
| Plot | Lyso | Other | |||||||||||
| Expt C |
3 peptides |
12 spectra |
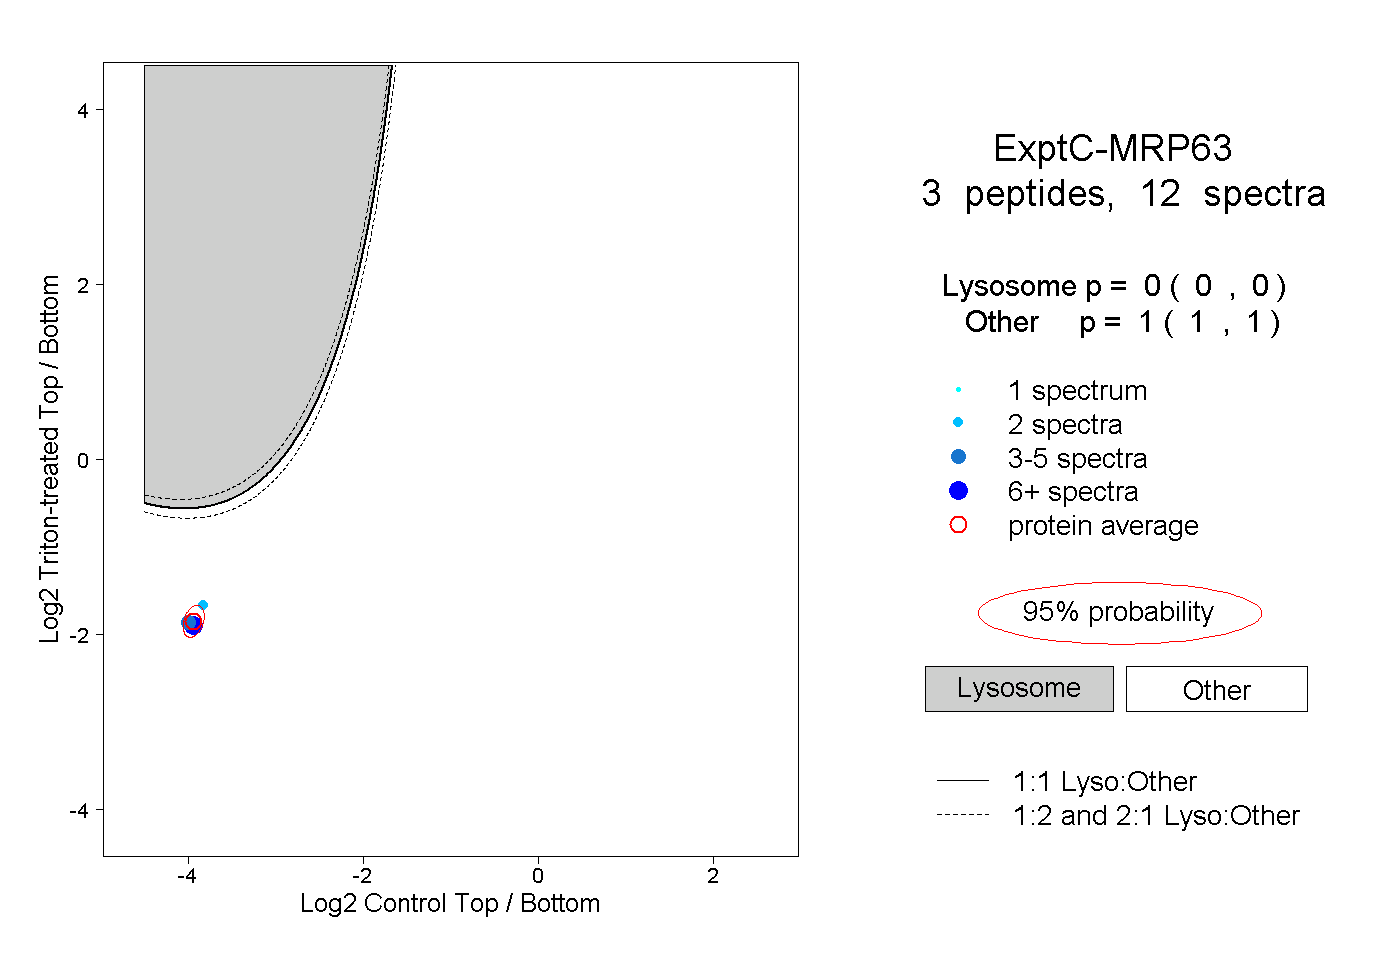 |
0.000 0.000 | 0.000 |
1.000 1.000 | 1.000 |