18
18peptides
spectra
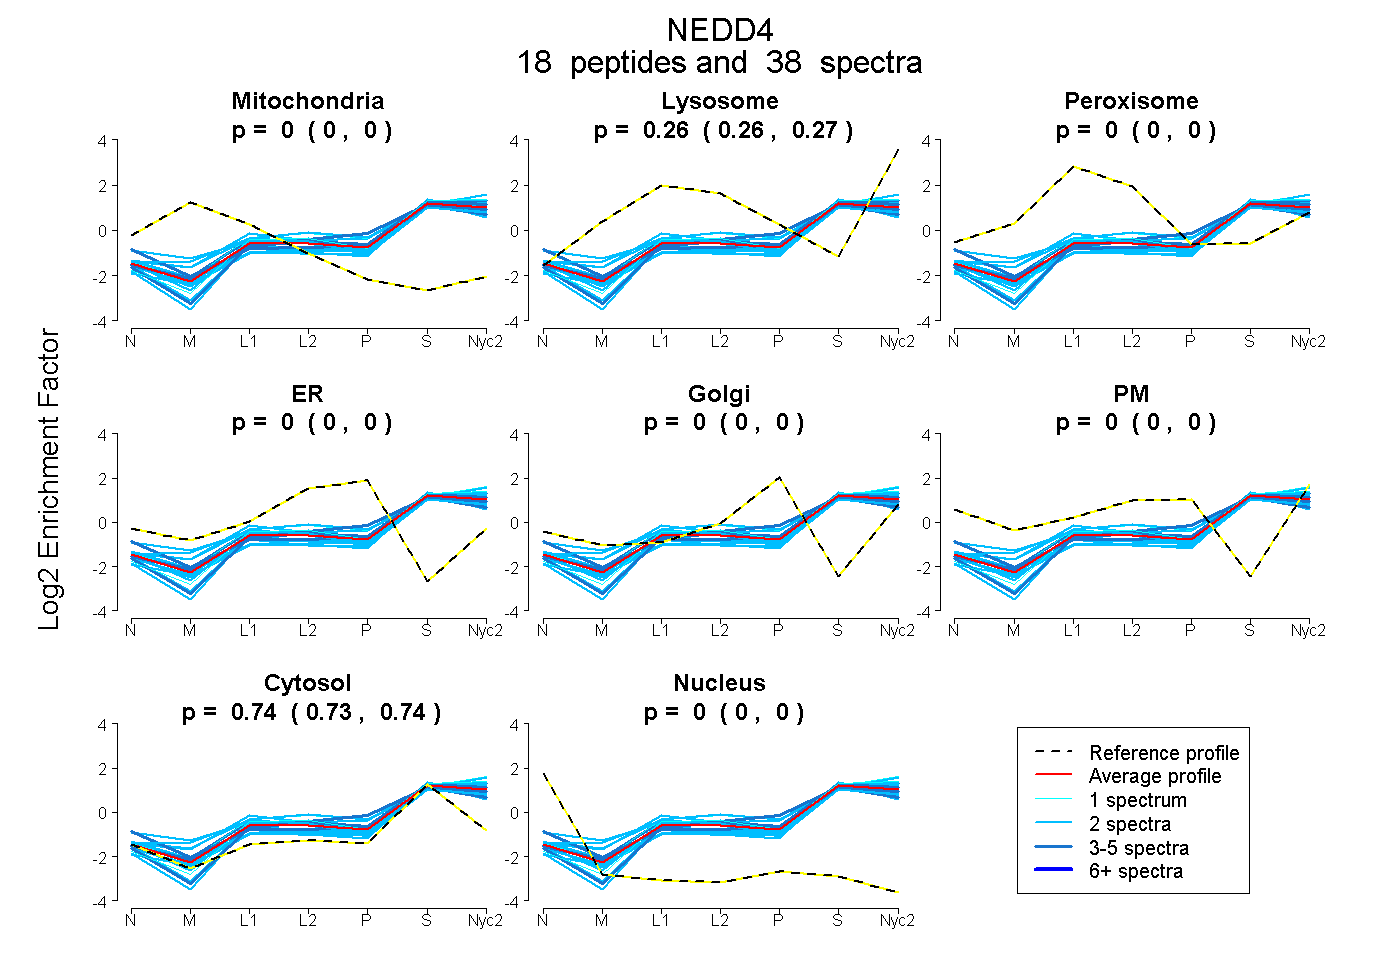
0.000 | 0.000
0.261 | 0.268
0.000 | 0.000
0.000 | 0.000
0.000 | 0.000
0.000 | 0.000
0.732 | 0.738
0.000 | 0.000
6peptides
spectra
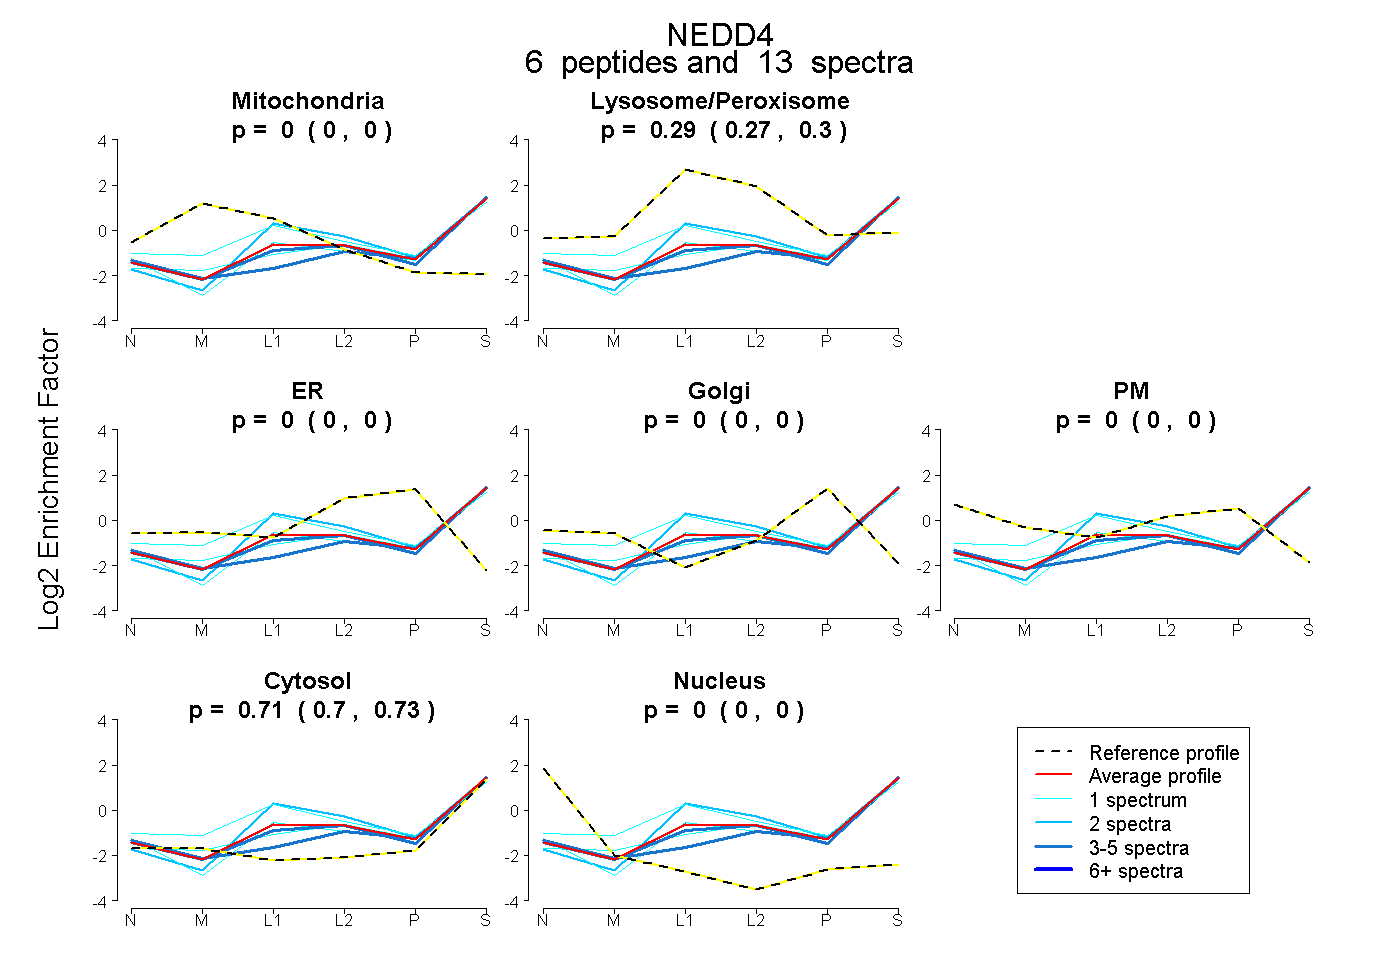
0.000 | 0.000
0.268 | 0.301
0.000 | 0.000
0.000 | 0.000
0.000 | 0.000
0.695 | 0.730
0.000 | 0.000