 2
2peptides
spectra
0.000 | 0.153
0.000 | 0.000
0.000 | 0.000
0.135 | 0.466
0.000 | 0.369
0.000 | 0.000
0.318 | 0.444
0.000 | 0.127
1peptide
spectrum
NA | NA
NA | NA
| Plot | Mito | Lyso | Perox | ER | Golgi | PM | Cytosol | Nucleus | |||||
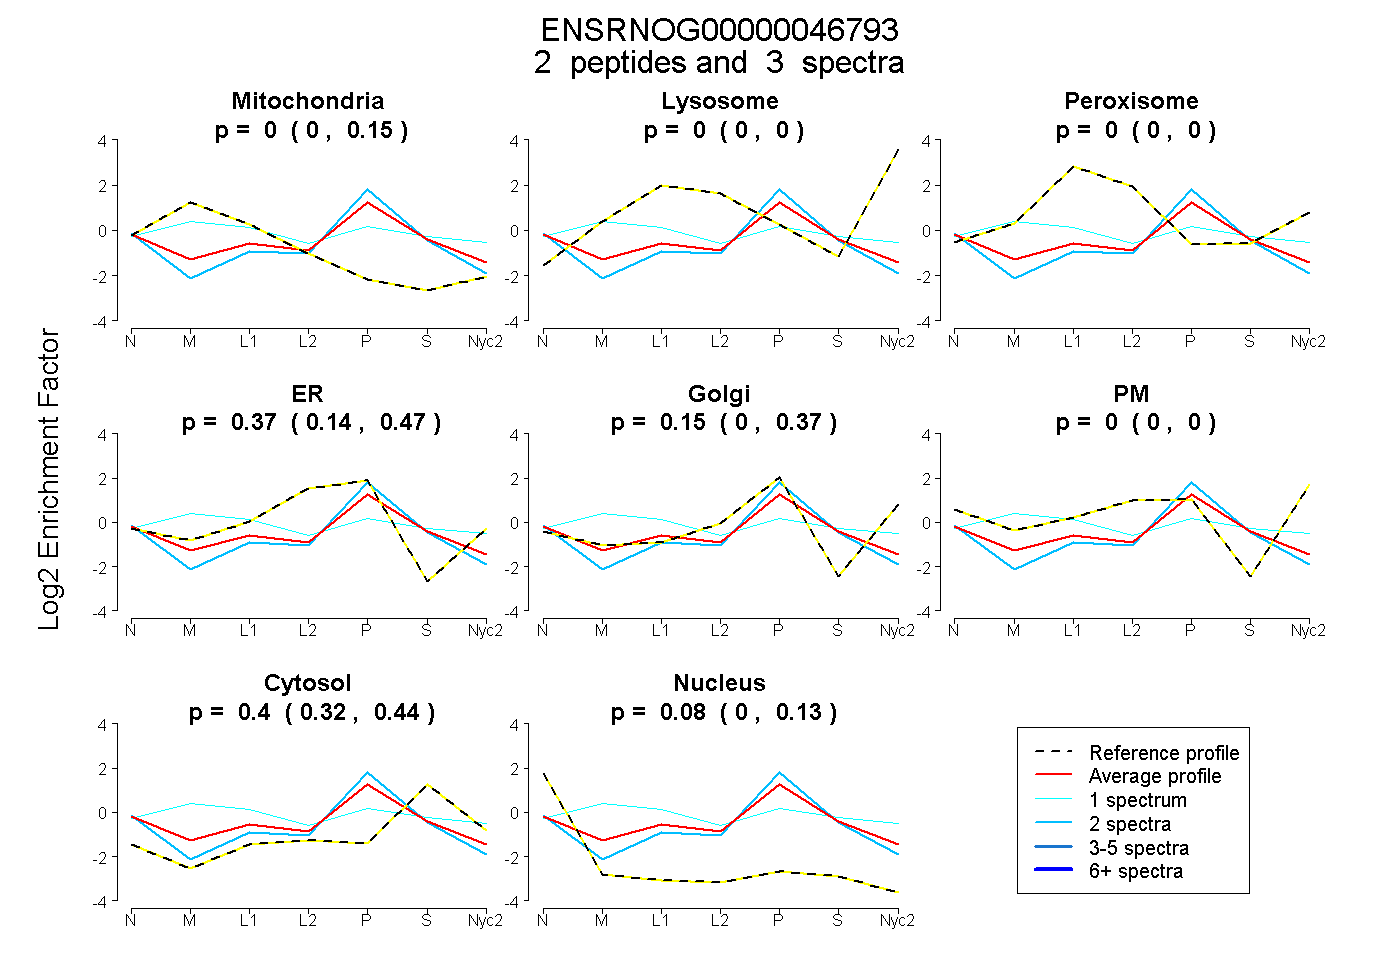
| Expt A |
2 peptides |
3 spectra |
|
0.001 0.000 | 0.153 |
0.000 0.000 | 0.000 |
0.000 0.000 | 0.000 |
0.370 0.135 | 0.466 |
0.146 0.000 | 0.369 |
0.000 0.000 | 0.000 |
0.399 0.318 | 0.444 |
0.084 0.000 | 0.127 |
||
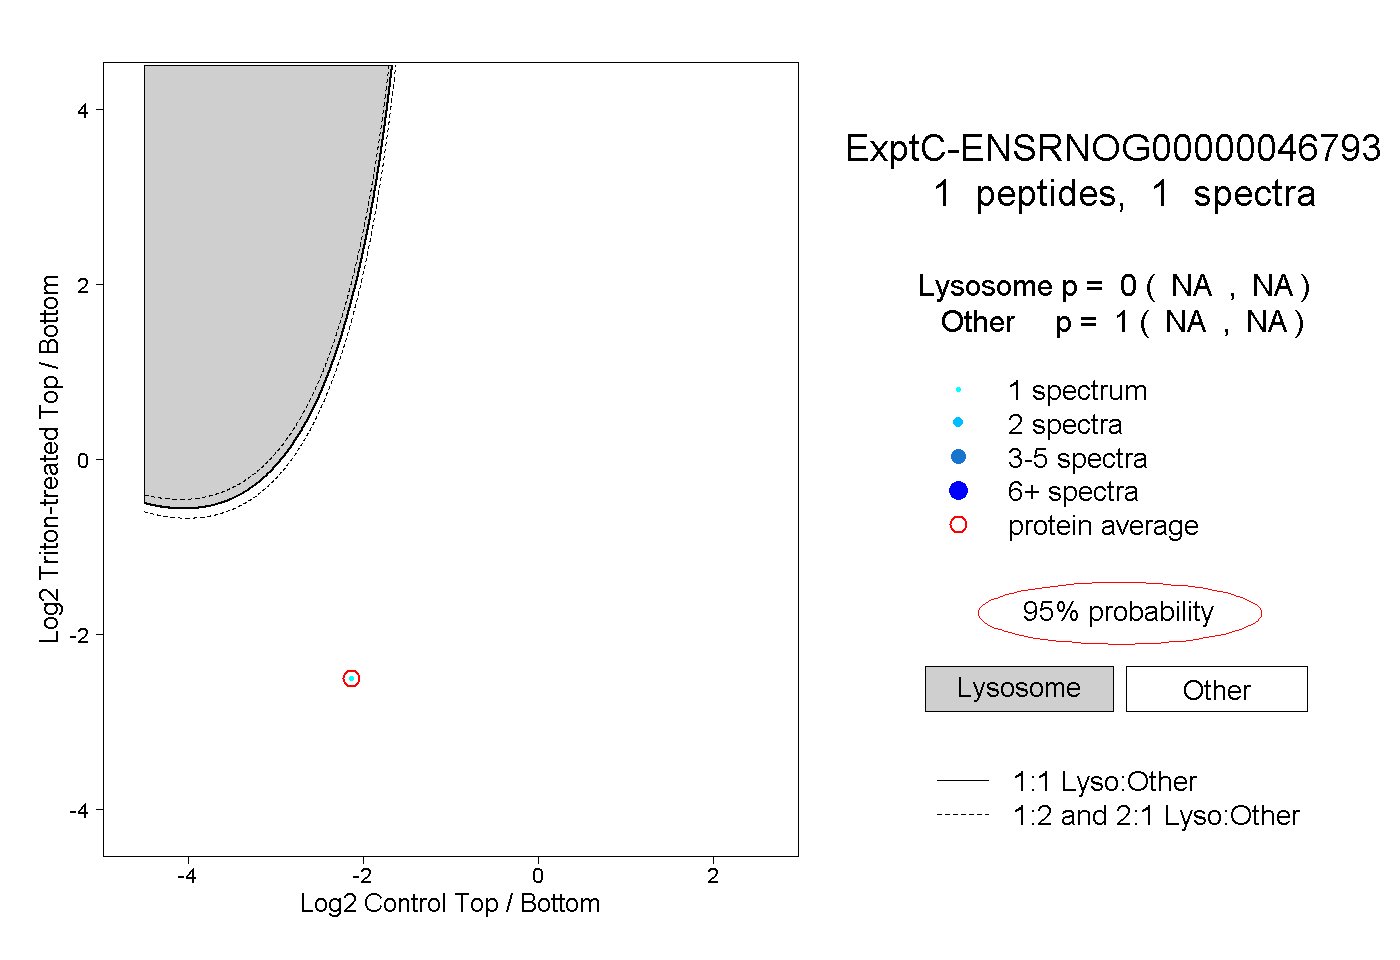
| Plot | Lyso | Other | |||||||||||
| Expt C |
1 peptide |
1 spectrum |
|
0.000 NA | NA |
1.000 NA | NA |