 6
6peptides
spectra
0.000 | 0.000
0.000 | 0.000
0.000 | 0.000
0.111 | 0.195
0.111 | 0.212
0.000 | 0.000
0.645 | 0.662
0.011 | 0.034
| Plot | Mito | Lyso | Perox | ER | Golgi | PM | Cytosol | Nucleus | |||||
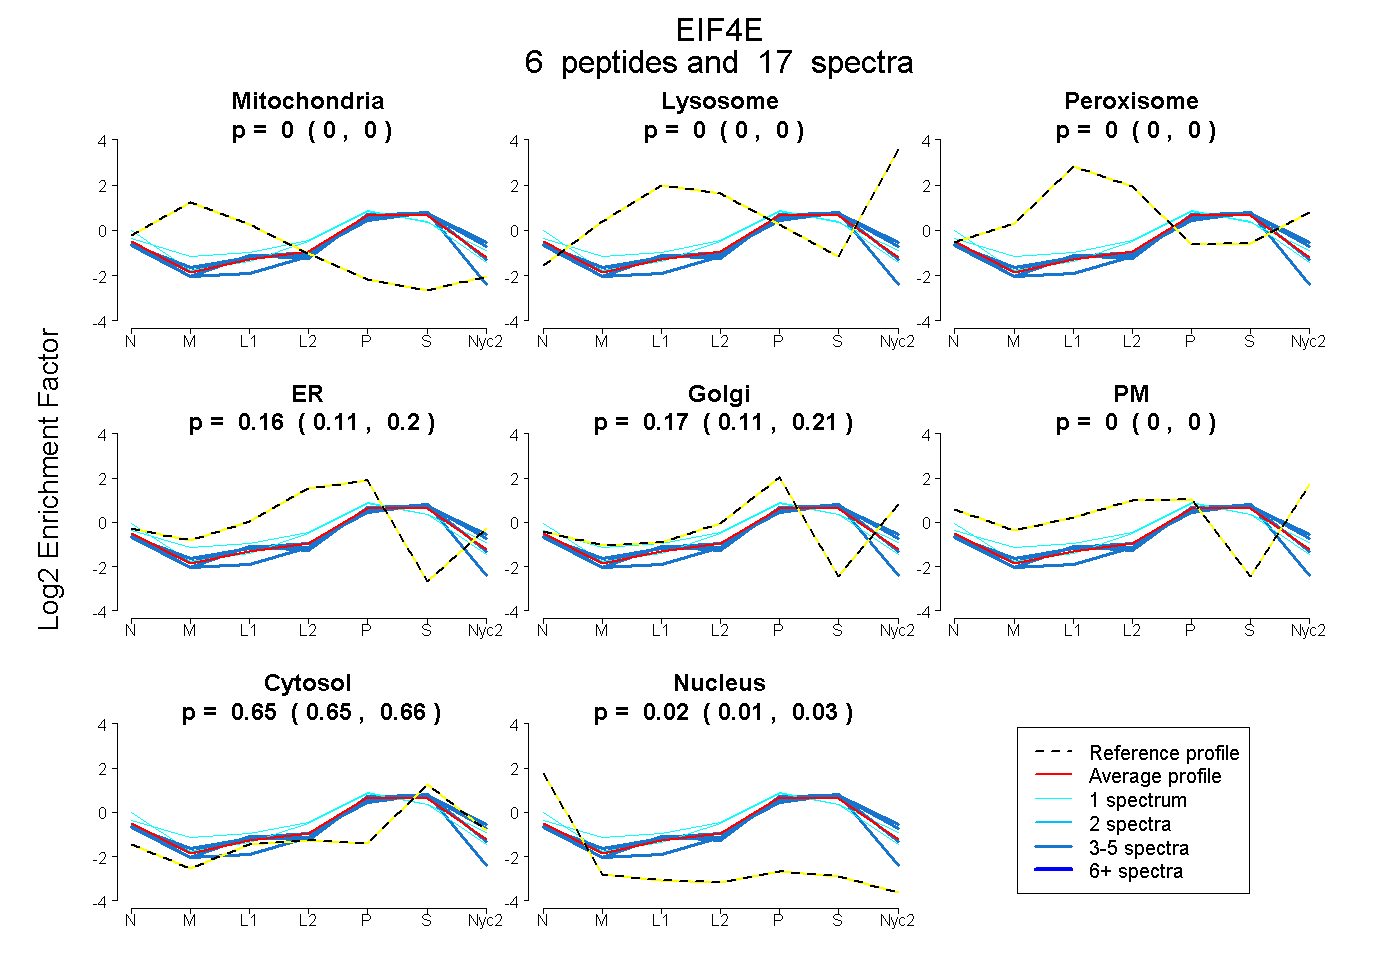
| Expt A |
6 peptides |
17 spectra |
|
0.000 0.000 | 0.000 |
0.000 0.000 | 0.000 |
0.000 0.000 | 0.000 |
0.155 0.111 | 0.195 |
0.168 0.111 | 0.212 |
0.000 0.000 | 0.000 |
0.654 0.645 | 0.662 |
0.023 0.011 | 0.034 |
| 4 spectra, DGIEPMWEDEK | 0.000 | 0.000 | 0.000 | 0.000 | 0.332 | 0.000 | 0.668 | 0.000 | ||
| 1 spectrum, TESNQEVANPEHYIK | 0.000 | 0.000 | 0.000 | 0.343 | 0.036 | 0.000 | 0.551 | 0.069 | ||
| 1 spectrum, IVIGYQSHADTATK | 0.000 | 0.000 | 0.000 | 0.314 | 0.140 | 0.000 | 0.546 | 0.000 | ||
| 3 spectra, DAVTHIGR | 0.000 | 0.000 | 0.000 | 0.242 | 0.000 | 0.000 | 0.671 | 0.087 | ||
| 5 spectra, WLITLNK | 0.000 | 0.000 | 0.000 | 0.000 | 0.269 | 0.000 | 0.688 | 0.043 | ||
| 3 spectra, TWQANLR | 0.000 | 0.000 | 0.000 | 0.000 | 0.351 | 0.000 | 0.649 | 0.000 |
| Plot | Mito | Lyso or Perox | ER | Golgi | PM | Cytosol | Nucleus | ||||||
| Expt B |
2 peptides |
4 spectra |
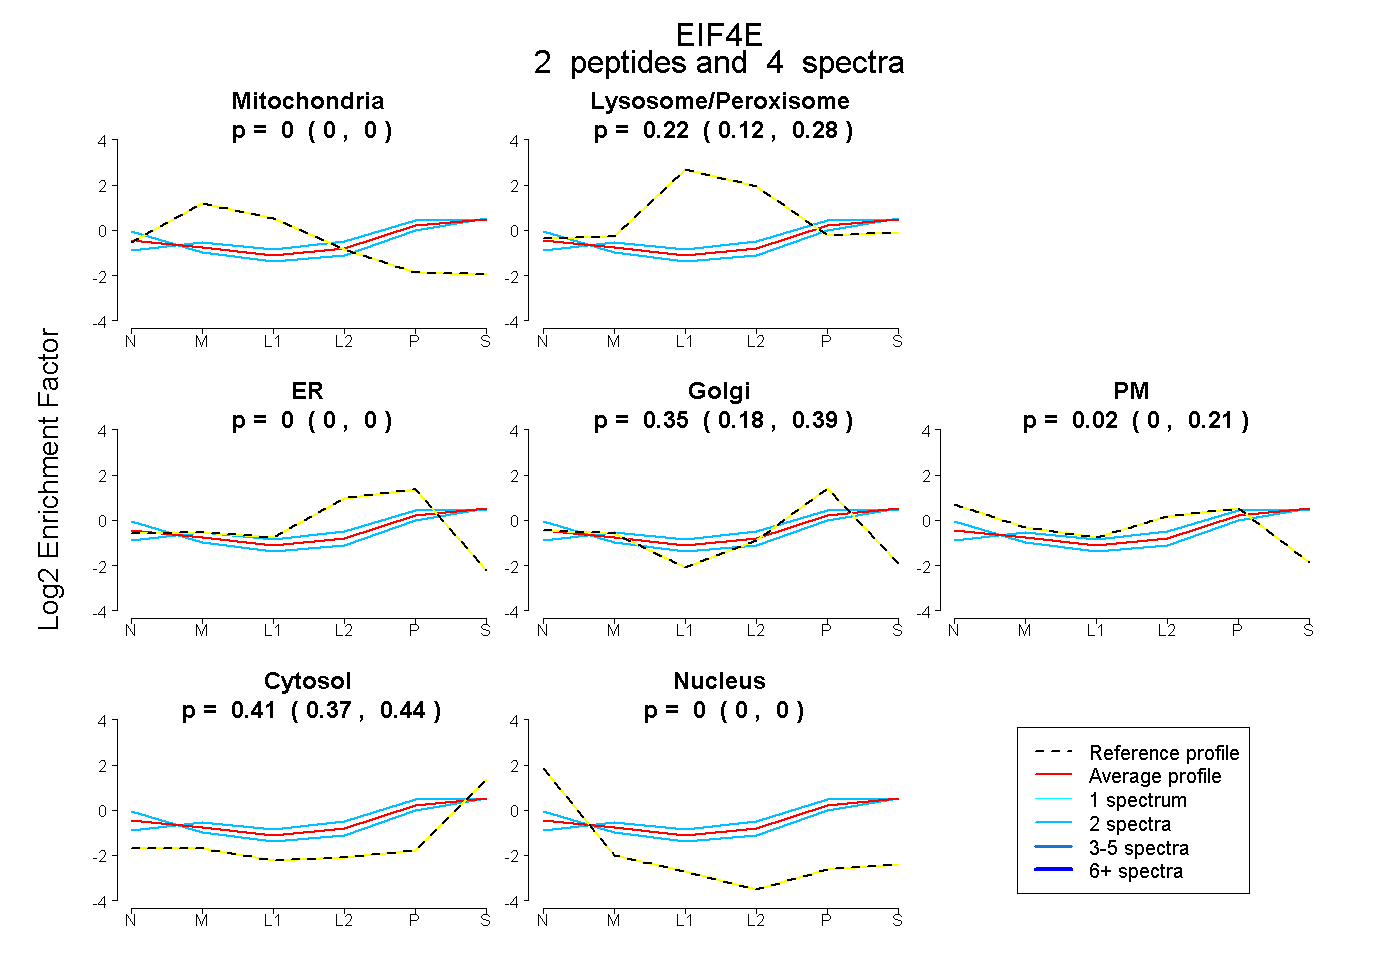 |
0.000 0.000 | 0.000 |
0.223 0.117 | 0.276 |
0.000 0.000 | 0.000 |
0.348 0.184 | 0.385 |
0.021 0.000 | 0.212 |
0.407 0.371 | 0.442 |
0.000 0.000 | 0.000 |
|||
| Plot | Lyso | Other | |||||||||||
| Expt C |
7 peptides |
18 spectra |
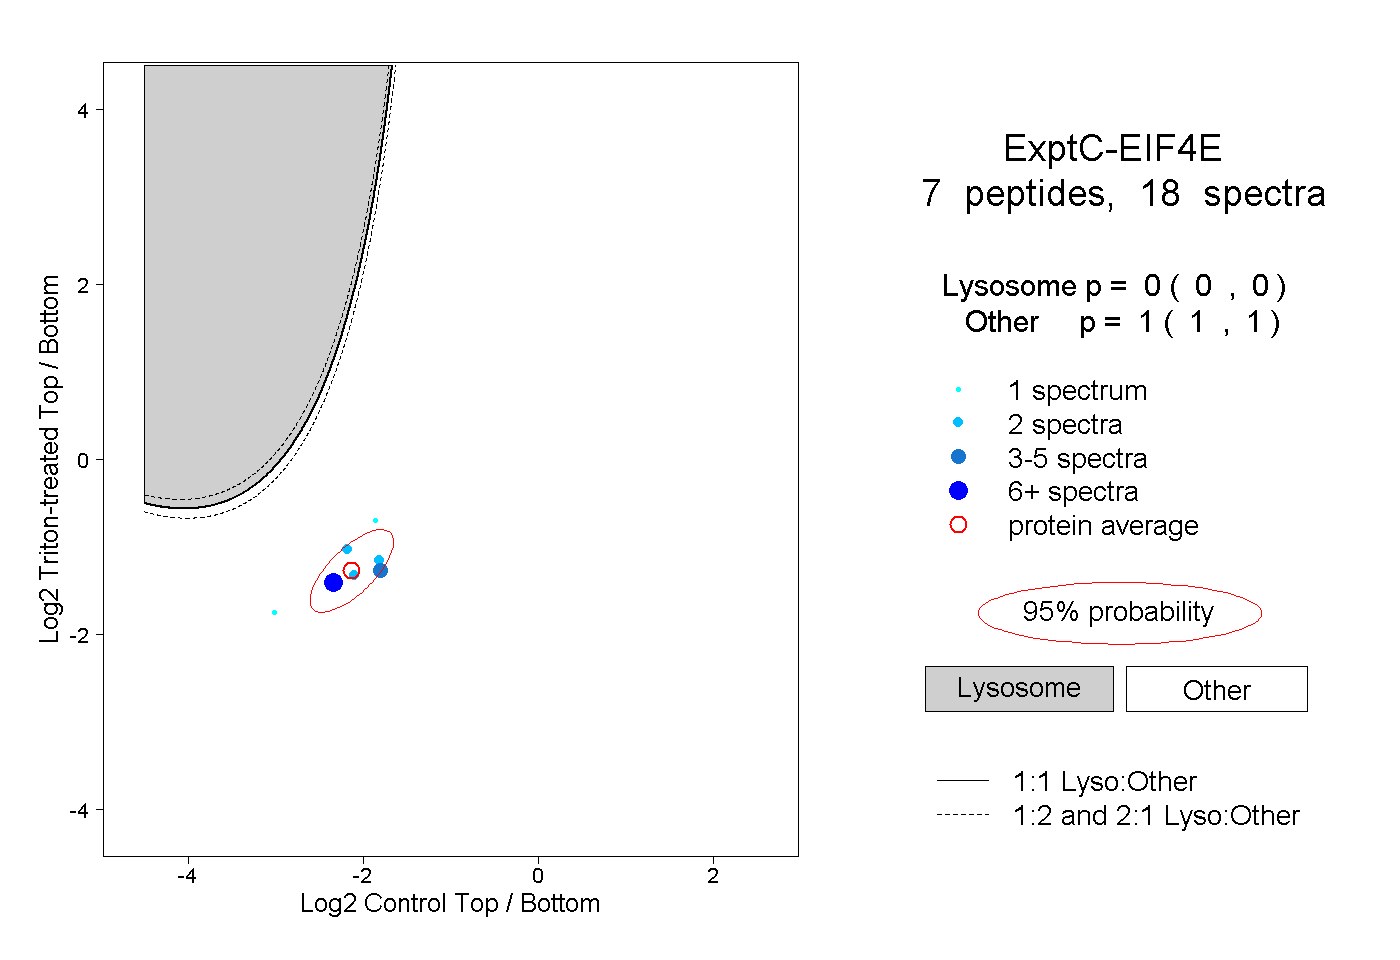 |
0.000 0.000 | 0.000 |
1.000 1.000 | 1.000 |
||||||||
| Plot | Lyso | Other | |||||||||||
| Expt D |
1 peptide |
1 spectrum |
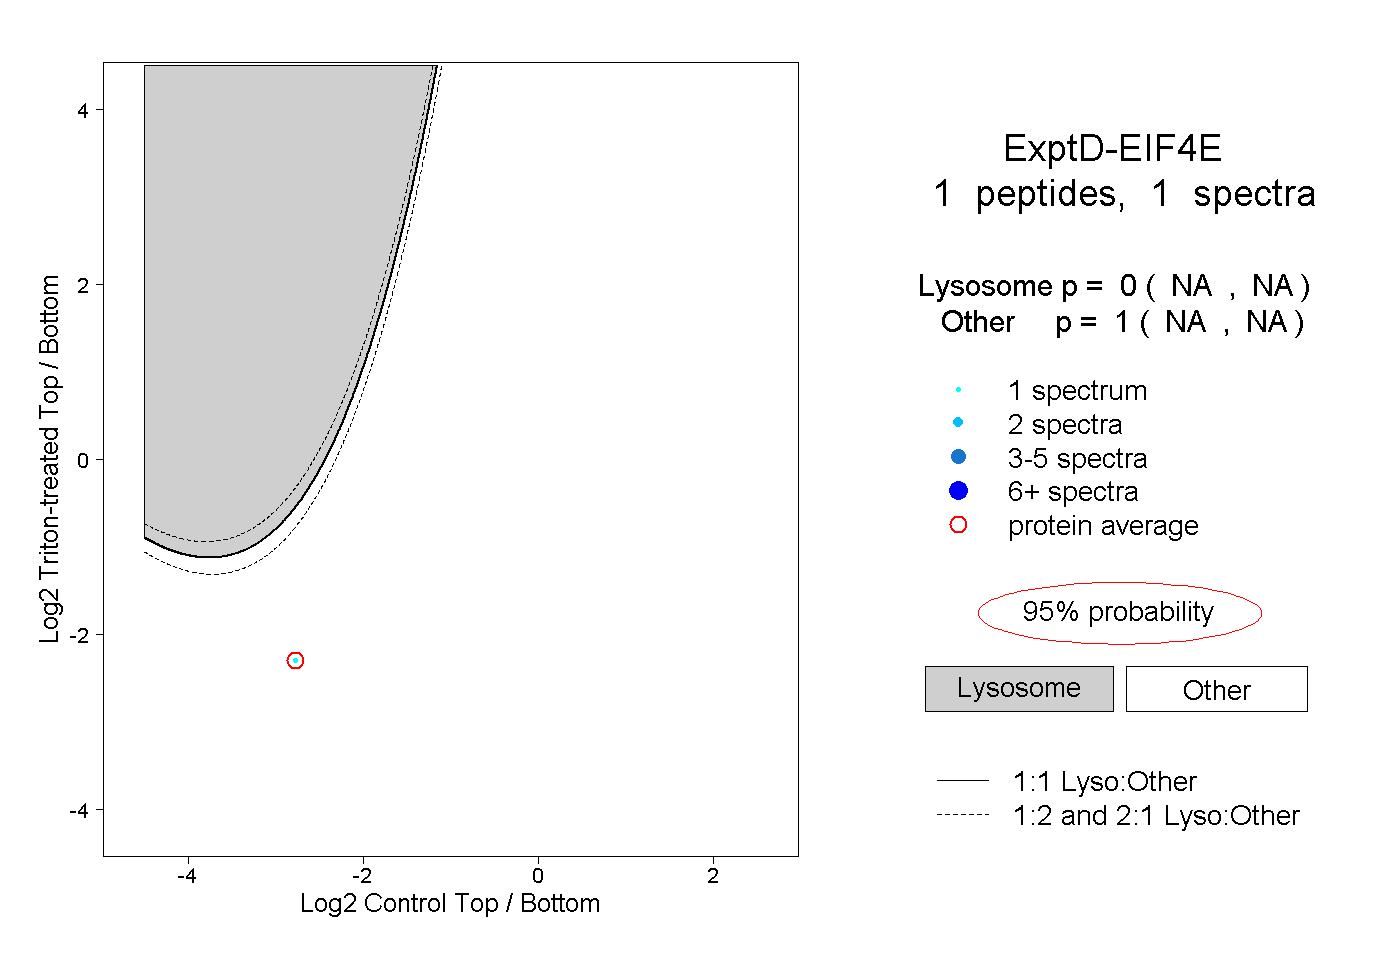 |
0.000 NA | NA |
1.000 NA | NA |