 8
8peptides
spectra
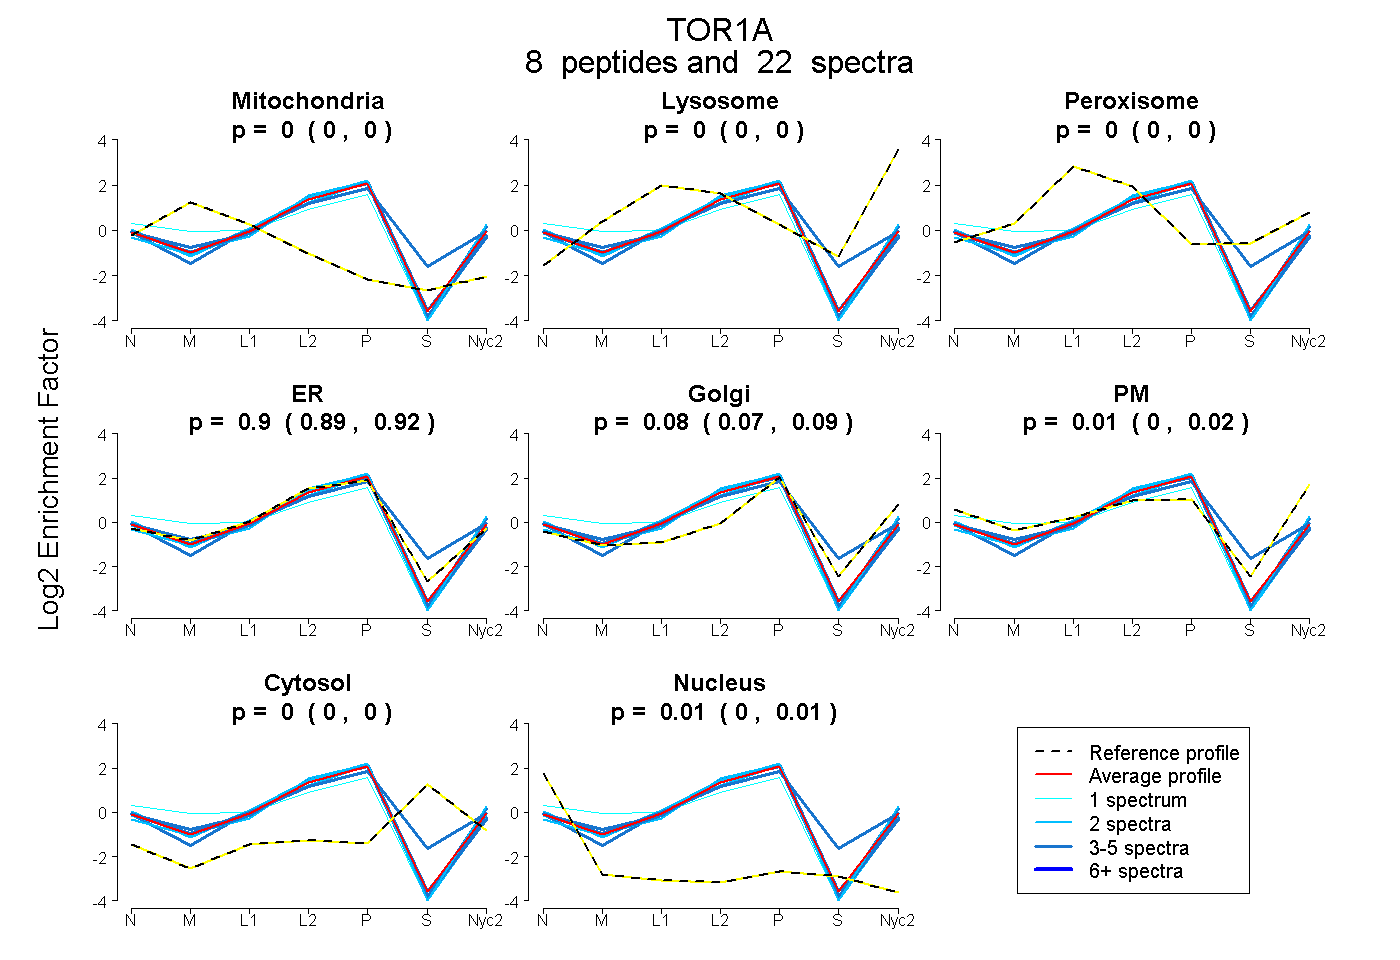
0.000 | 0.000
0.000 | 0.000
0.000 | 0.000
0.886 | 0.916
0.065 | 0.092
0.000 | 0.023
0.000 | 0.000
0.002 | 0.008
2peptides
spectra
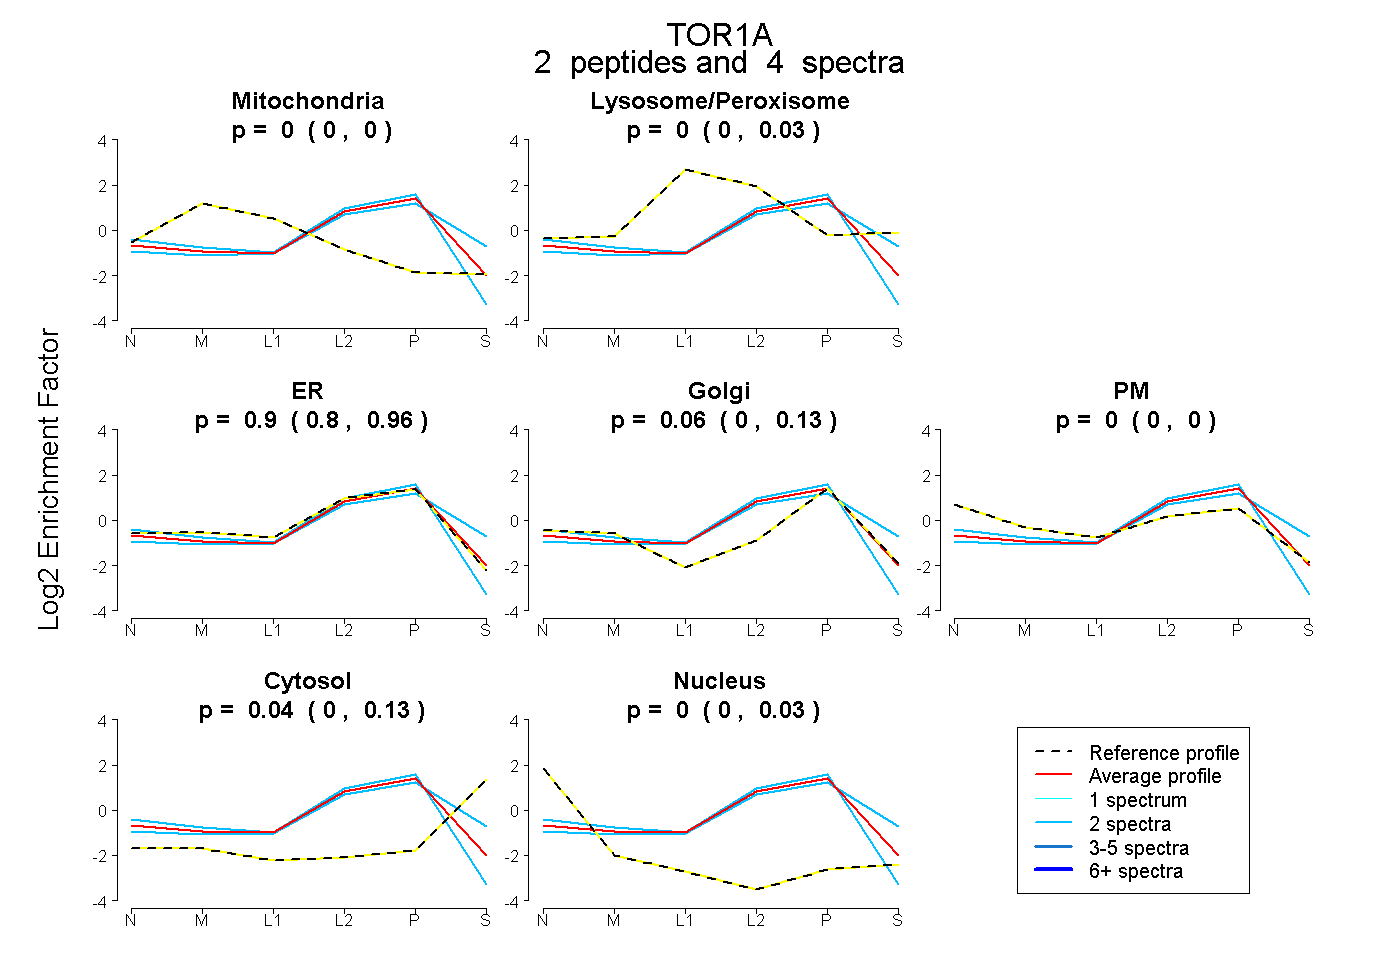
0.000 | 0.000
0.000 | 0.028
0.801 | 0.957
0.000 | 0.125
0.000 | 0.000
0.000 | 0.126
0.000 | 0.032
5peptides
spectra
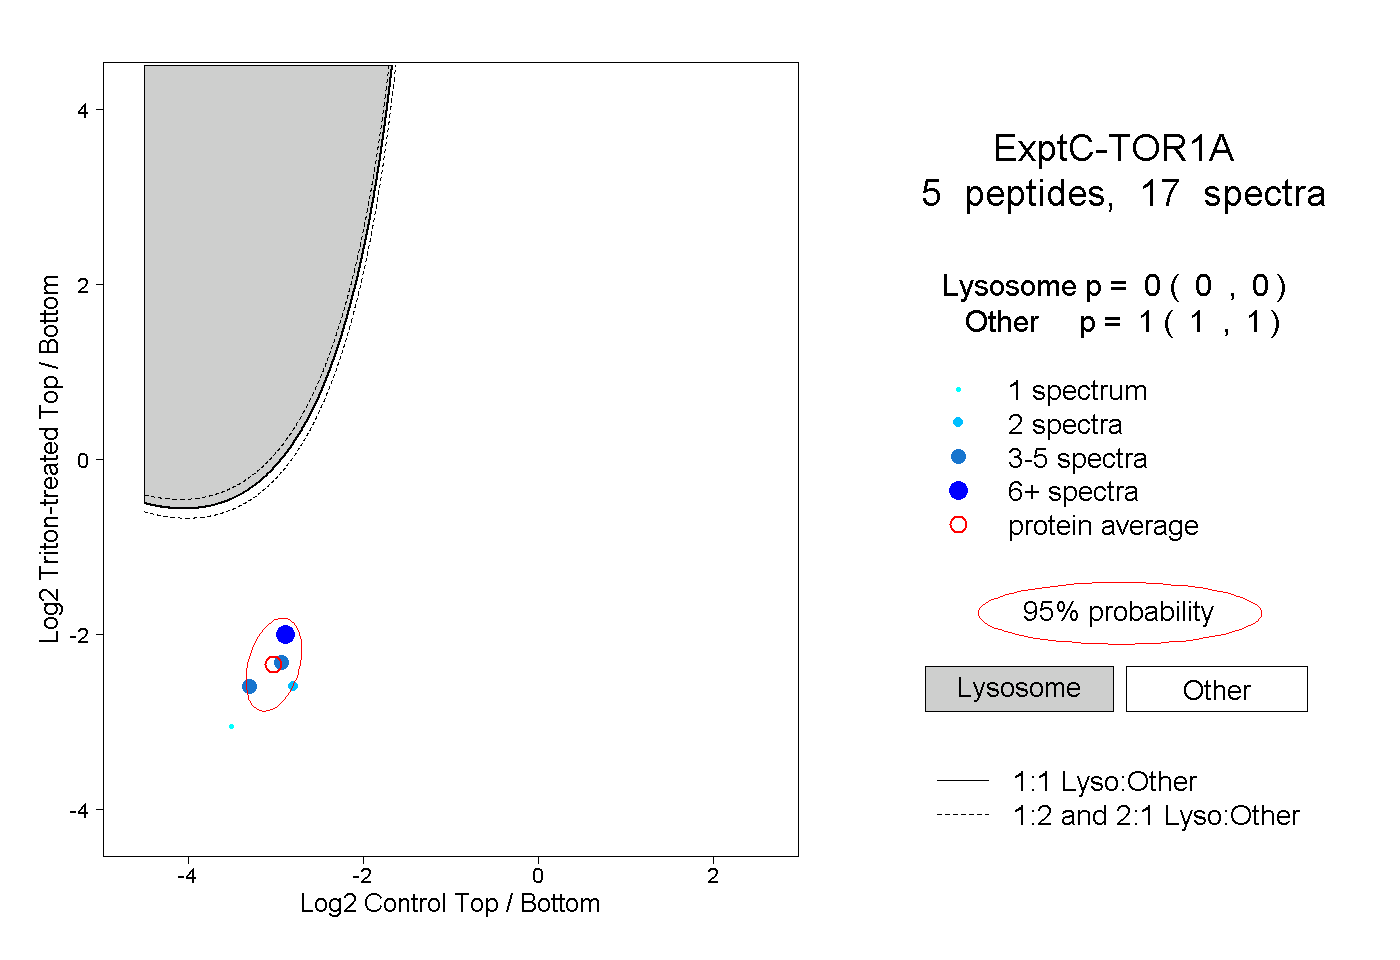
0.000 | 0.000
1.000 | 1.000
2peptides
spectra
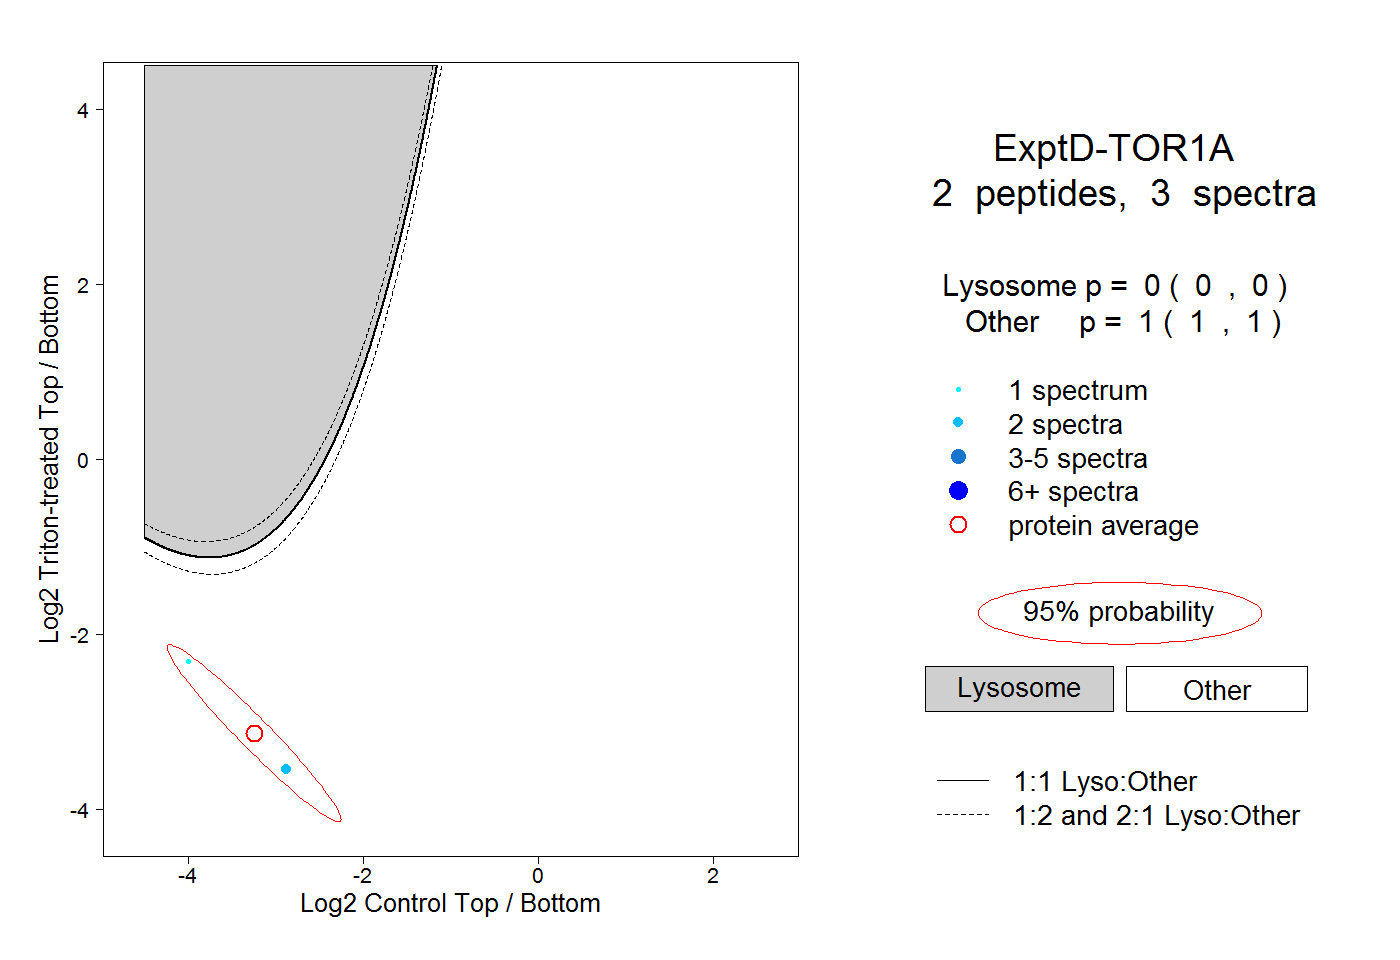
0.000 | 0.000
1.000 | 1.000