 8
8peptides
spectra
0.000 | 0.000
0.000 | 0.000
0.000 | 0.000
0.886 | 0.916
0.065 | 0.092
0.000 | 0.023
0.000 | 0.000
0.002 | 0.008
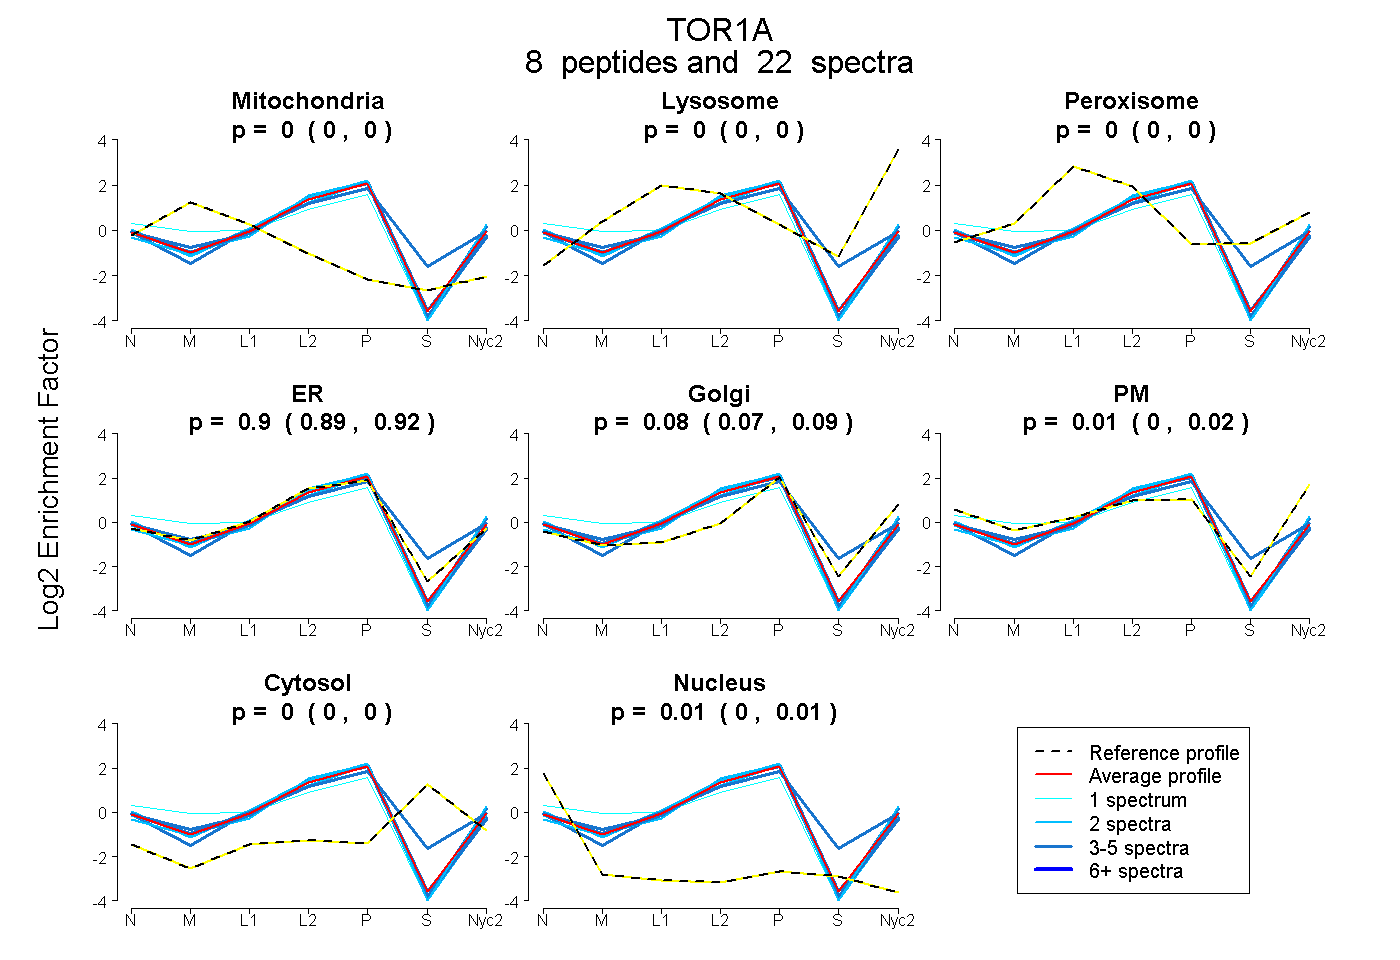
| Plot | Mito | Lyso | Perox | ER | Golgi | PM | Cytosol | Nucleus | |||||
| Expt A |
8 peptides |
22 spectra |
|
0.000 0.000 | 0.000 |
0.000 0.000 | 0.000 |
0.000 0.000 | 0.000 |
0.903 0.886 | 0.916 |
0.080 0.065 | 0.092 |
0.012 0.000 | 0.023 |
0.000 0.000 | 0.000 |
0.005 0.002 | 0.008 |
| 4 spectra, GYEEDEDIINK | 0.000 | 0.000 | 0.000 | 0.962 | 0.019 | 0.000 | 0.000 | 0.019 | ||
| 1 spectrum, DMEHALAVSVFNNK | 0.104 | 0.000 | 0.000 | 0.605 | 0.008 | 0.283 | 0.000 | 0.000 | ||
| 3 spectra, VEMQSR | 0.000 | 0.000 | 0.061 | 0.687 | 0.125 | 0.032 | 0.096 | 0.000 | ||
| 5 spectra, SLFLFDEMDK | 0.000 | 0.000 | 0.000 | 0.843 | 0.091 | 0.067 | 0.000 | 0.000 | ||
| 2 spectra, DQLQMWIR | 0.000 | 0.000 | 0.000 | 0.916 | 0.062 | 0.000 | 0.000 | 0.022 | ||
| 2 spectra, ITDVALDFWR | 0.000 | 0.000 | 0.000 | 0.989 | 0.000 | 0.000 | 0.000 | 0.011 | ||
| 2 spectra, VAEEMTFFPK | 0.000 | 0.000 | 0.000 | 0.878 | 0.088 | 0.034 | 0.000 | 0.000 | ||
| 3 spectra, LFGQHLAK | 0.000 | 0.000 | 0.000 | 0.983 | 0.000 | 0.000 | 0.000 | 0.017 |
| Plot | Mito | Lyso or Perox | ER | Golgi | PM | Cytosol | Nucleus | ||||||
| Expt B |
2 peptides |
4 spectra |
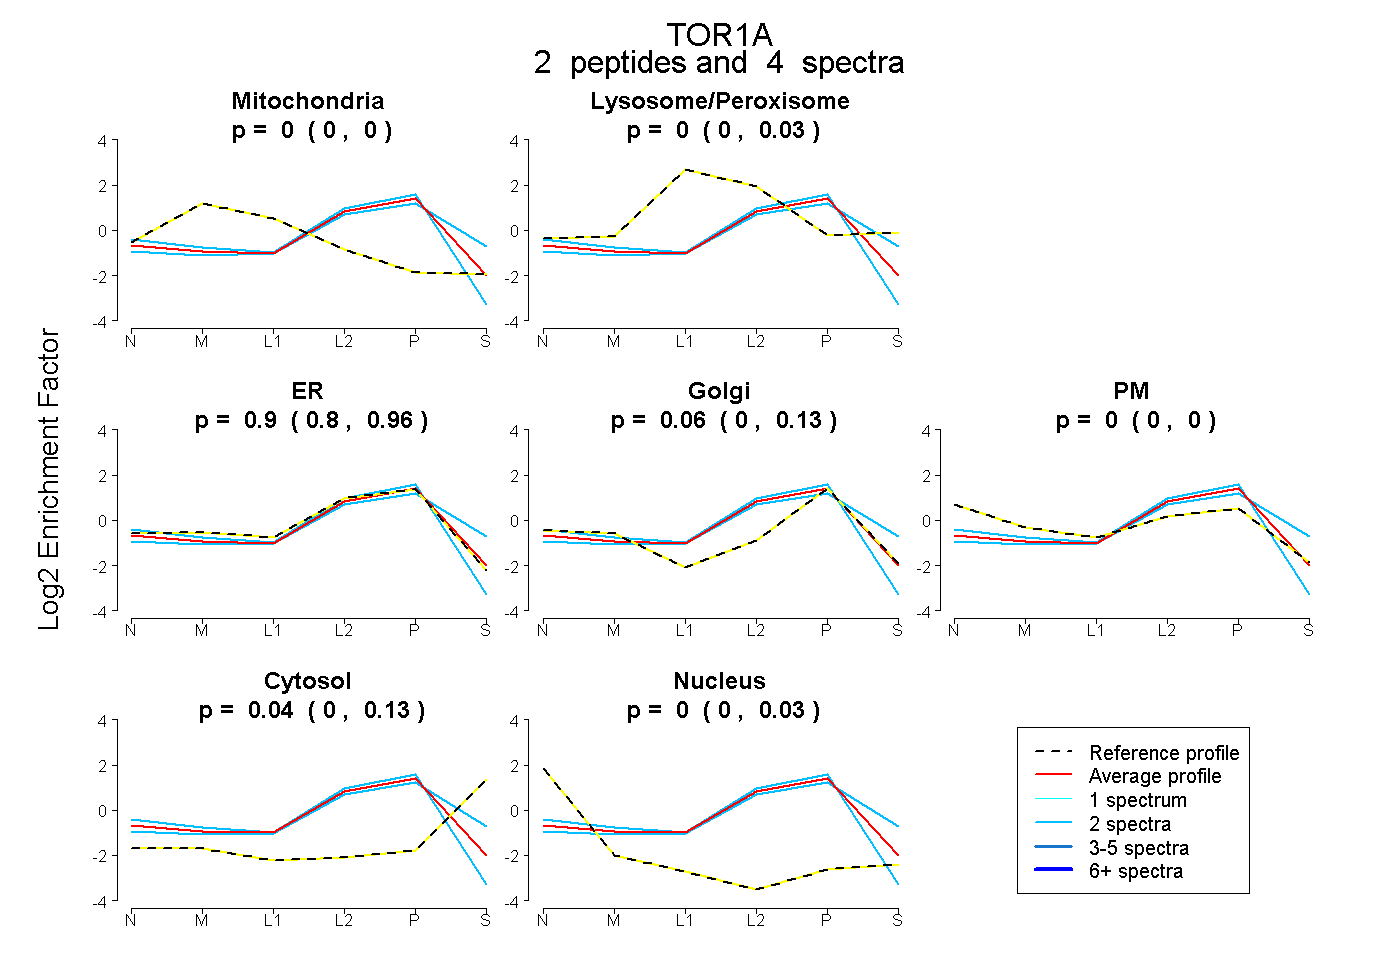 |
0.000 0.000 | 0.000 |
0.000 0.000 | 0.028 |
0.899 0.801 | 0.957 |
0.061 0.000 | 0.125 |
0.000 0.000 | 0.000 |
0.040 0.000 | 0.126 |
0.000 0.000 | 0.032 |
|||
| Plot | Lyso | Other | |||||||||||
| Expt C |
5 peptides |
17 spectra |
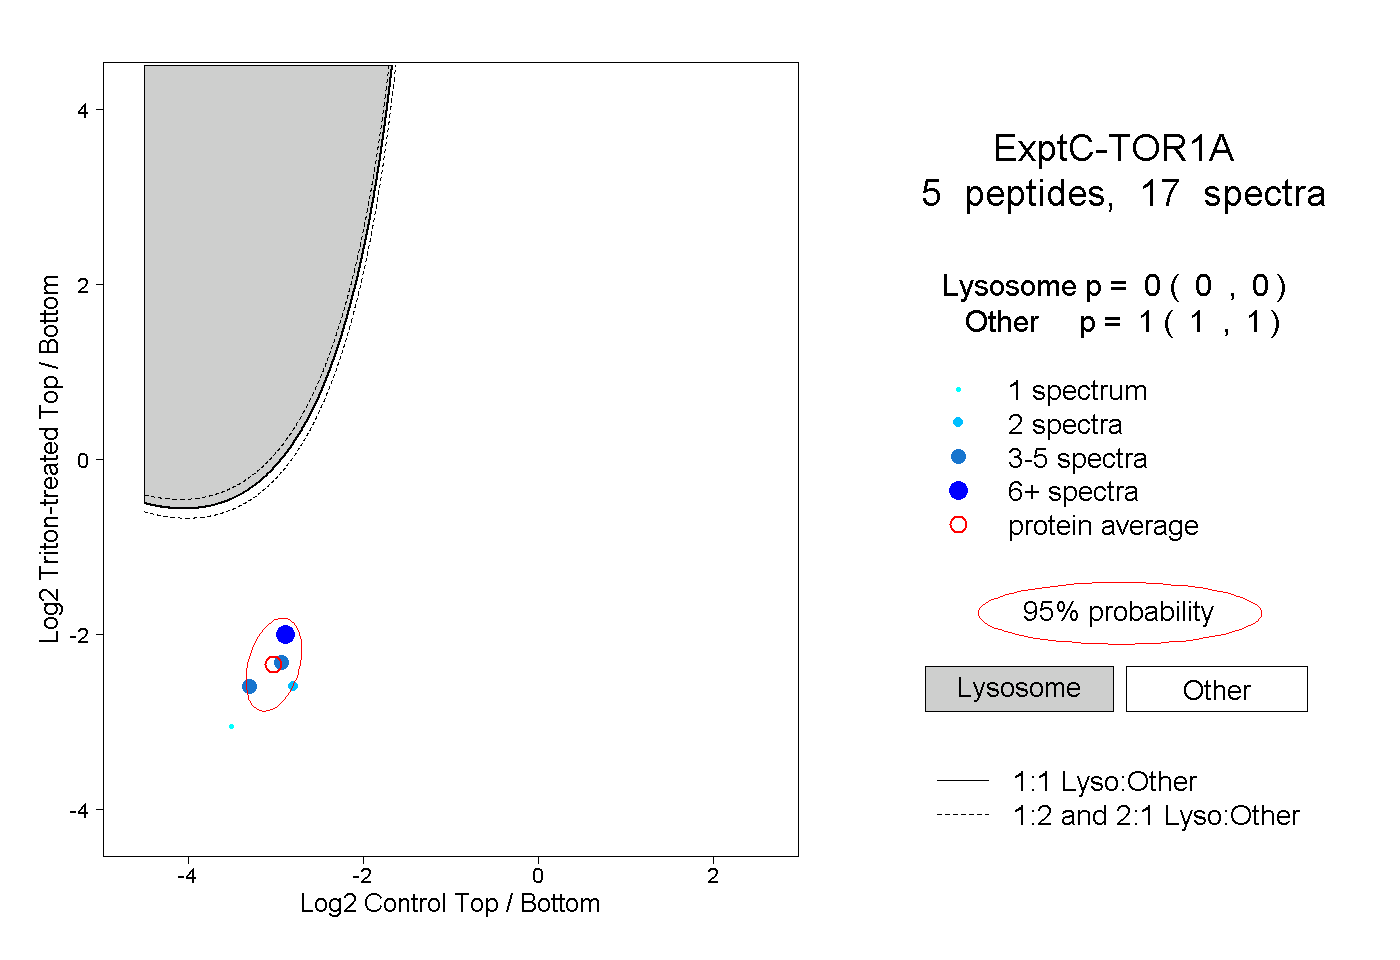 |
0.000 0.000 | 0.000 |
1.000 1.000 | 1.000 |
||||||||
| Plot | Lyso | Other | |||||||||||
| Expt D |
2 peptides |
3 spectra |
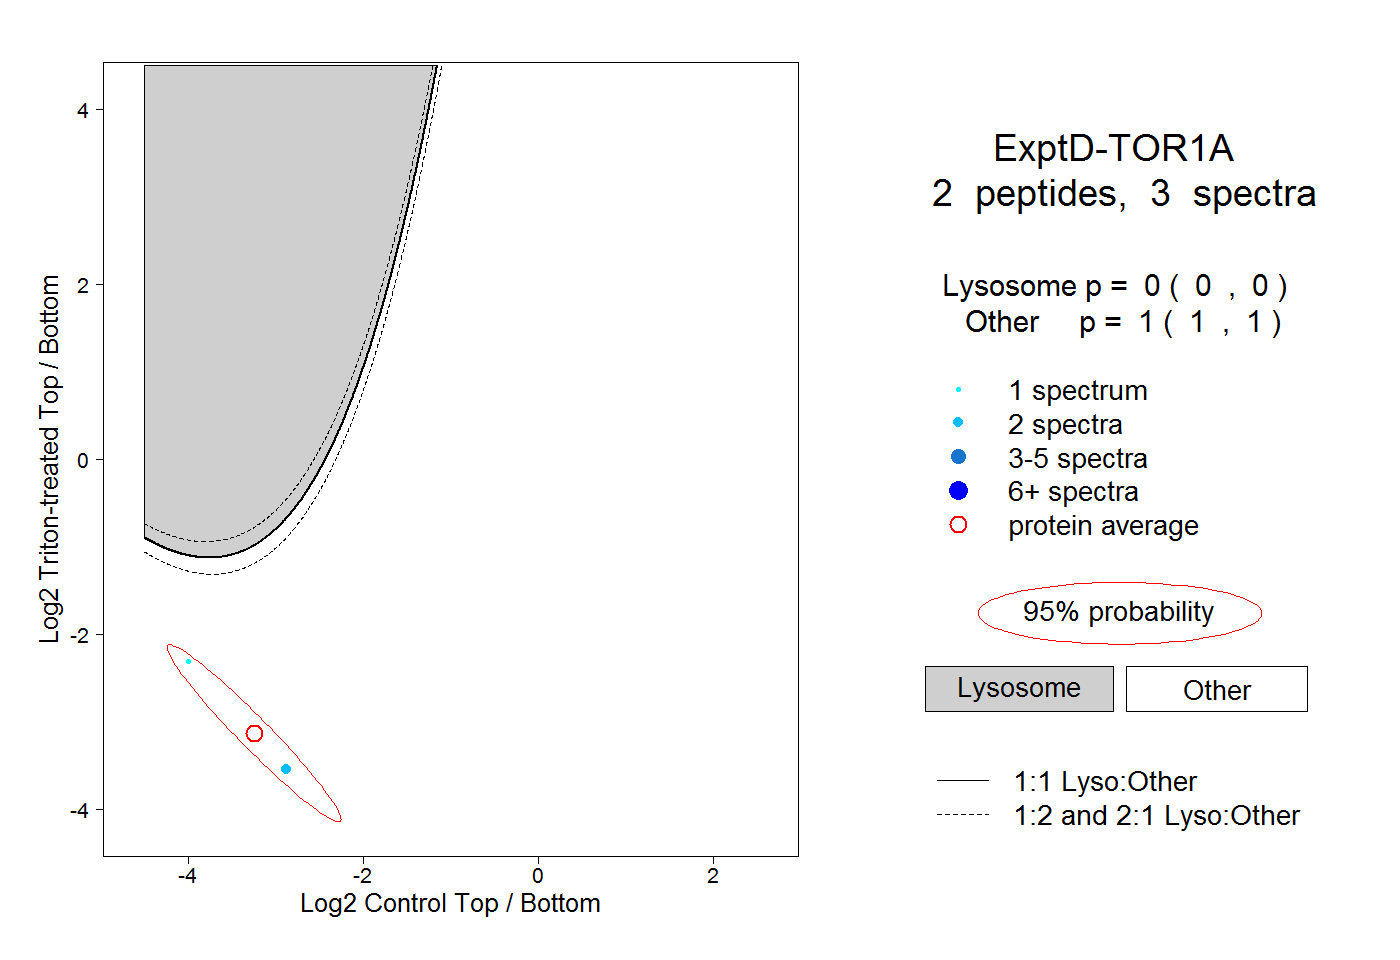 |
0.000 0.000 | 0.000 |
1.000 1.000 | 1.000 |