 8
8peptides
spectra
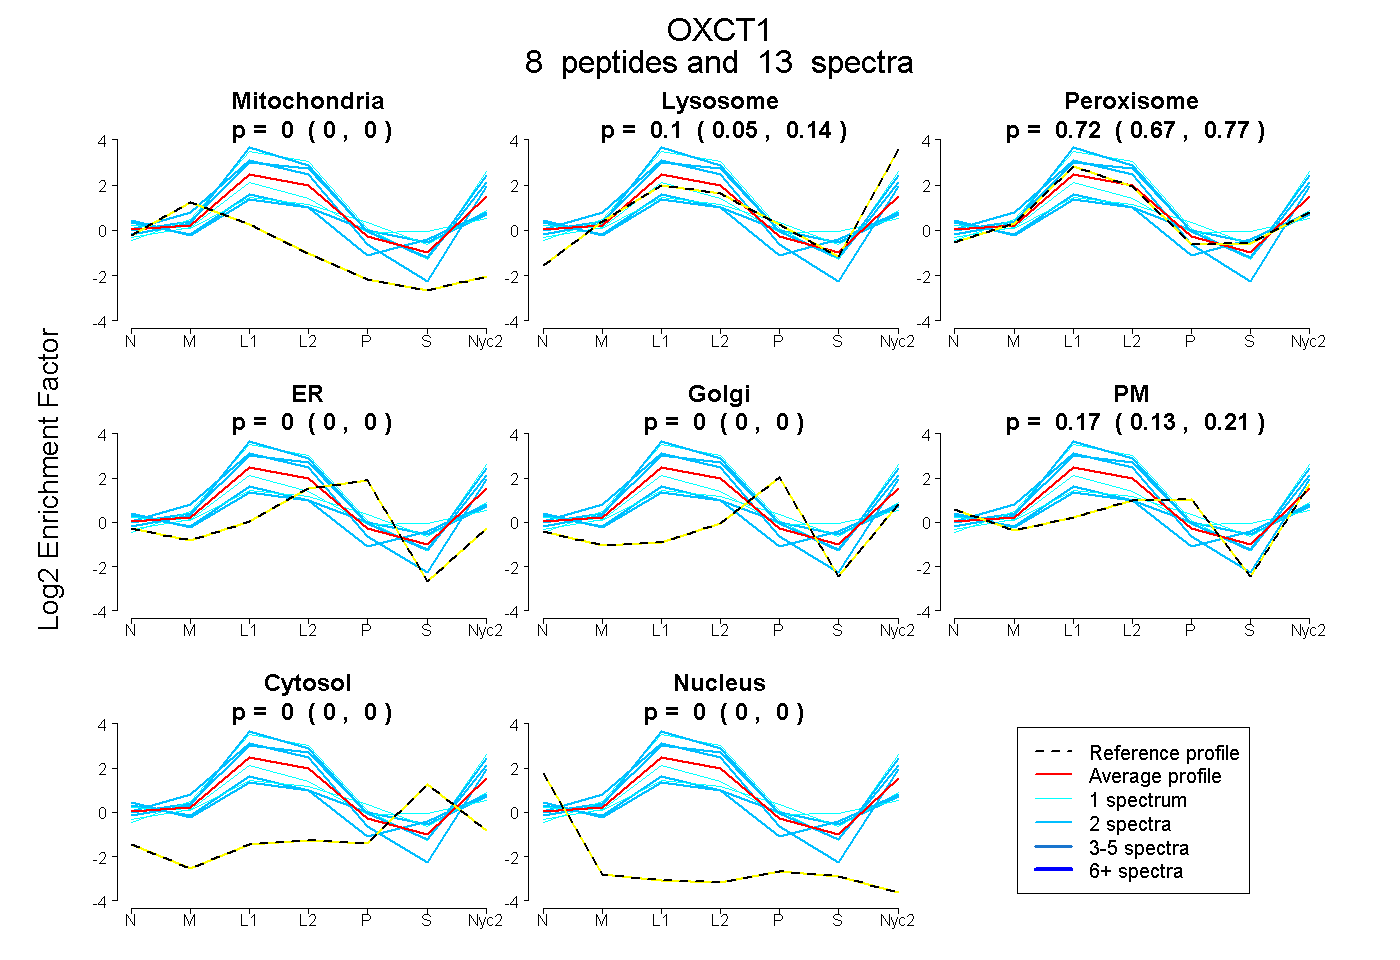
0.000 | 0.000
0.052 | 0.144
0.670 | 0.766
0.000 | 0.000
0.000 | 0.000
0.133 | 0.206
0.000 | 0.000
0.000 | 0.000
1peptide
spectrum
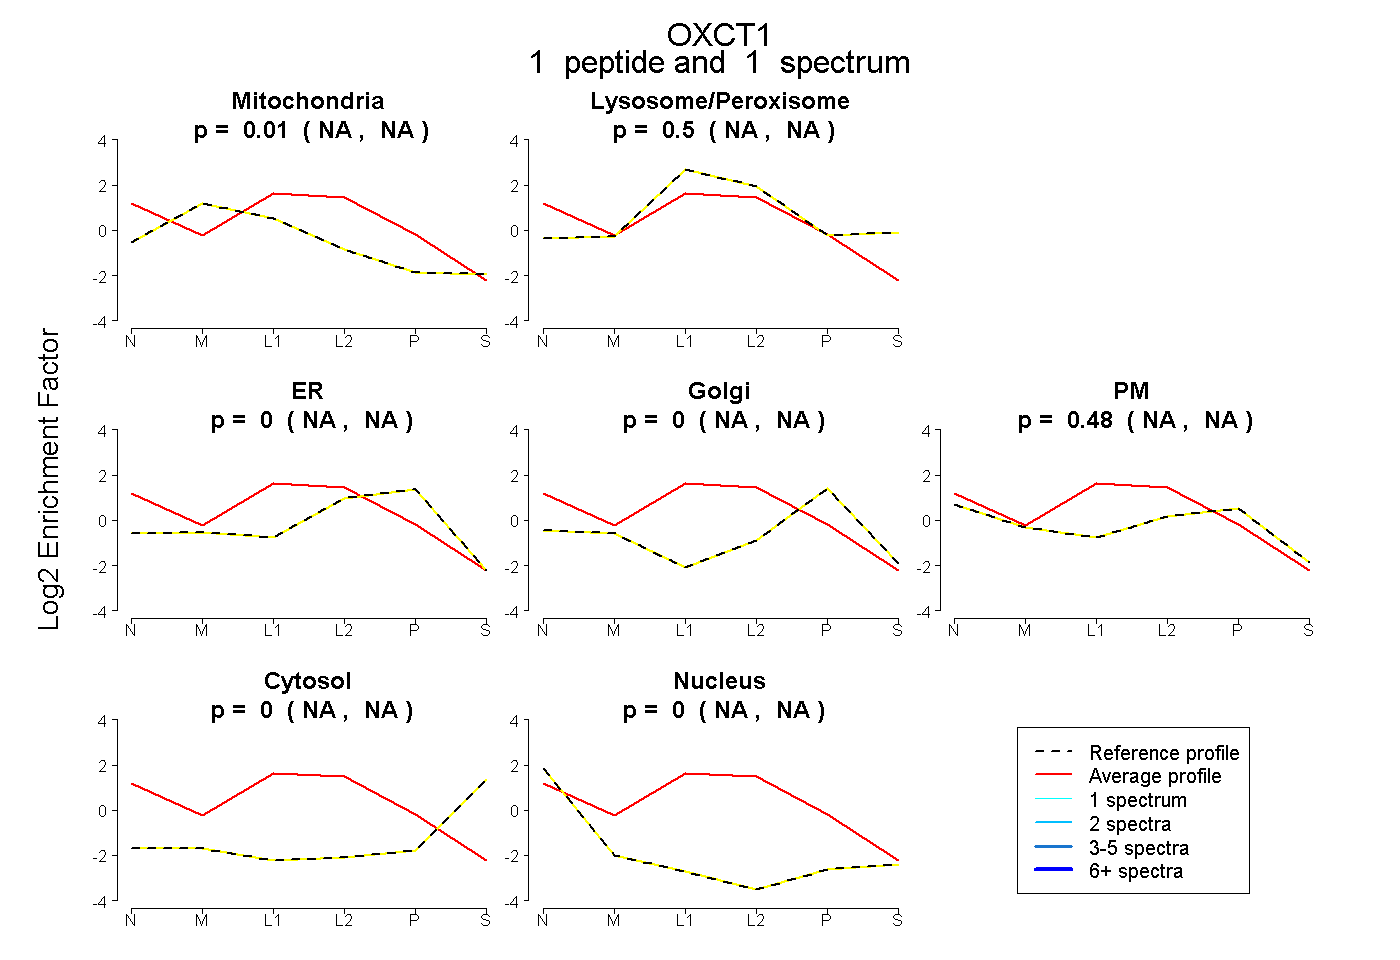
NA | NA
NA | NA
NA | NA
NA | NA
NA | NA
NA | NA
NA | NA
13peptides
spectra
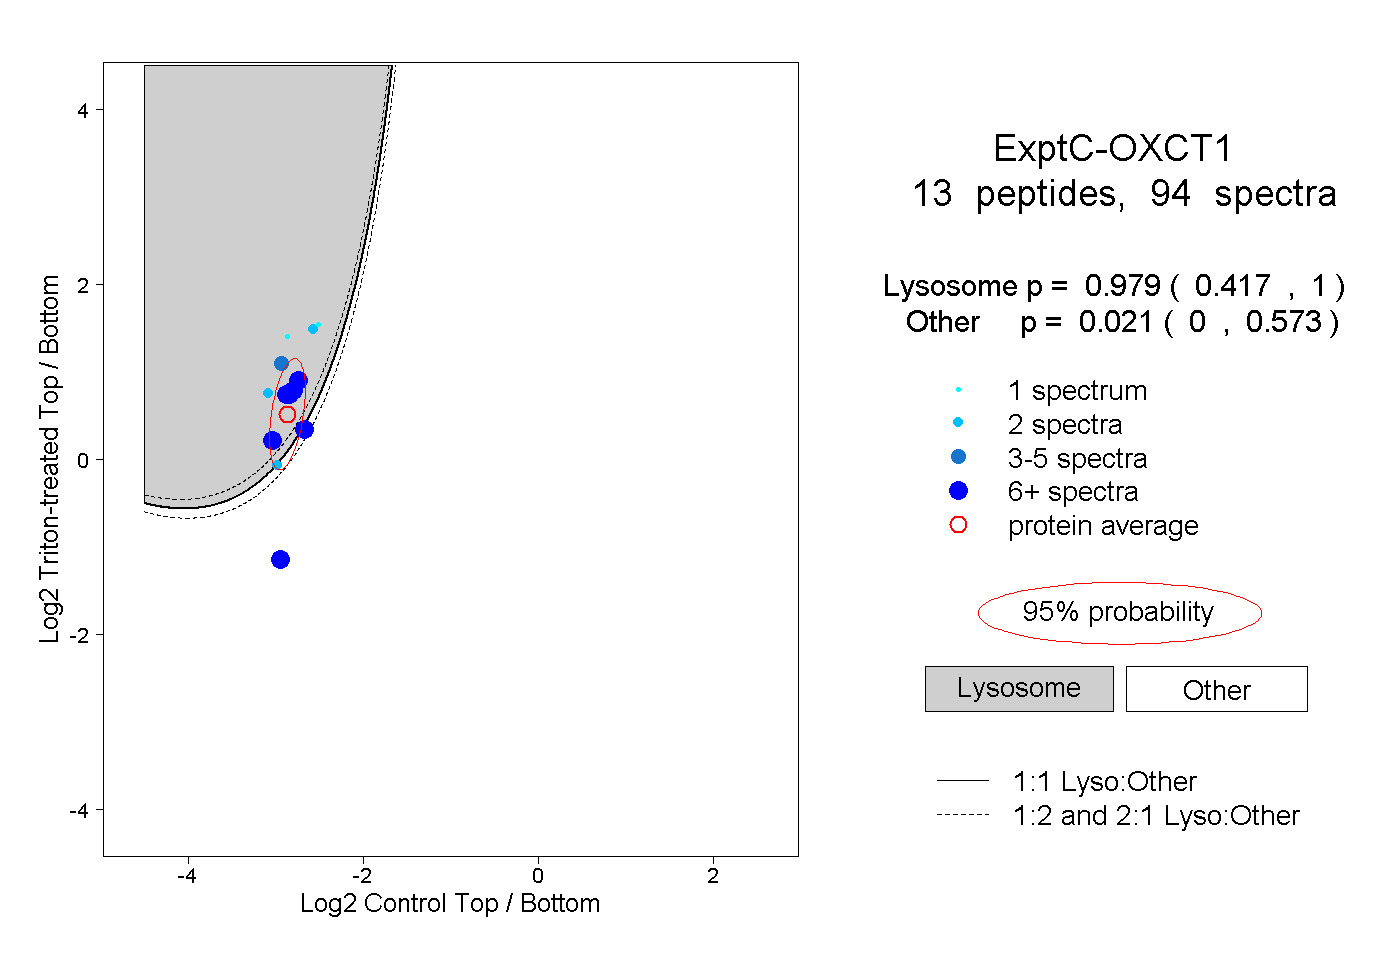
0.417 | 1.000
0.000 | 0.573
3peptides
spectra
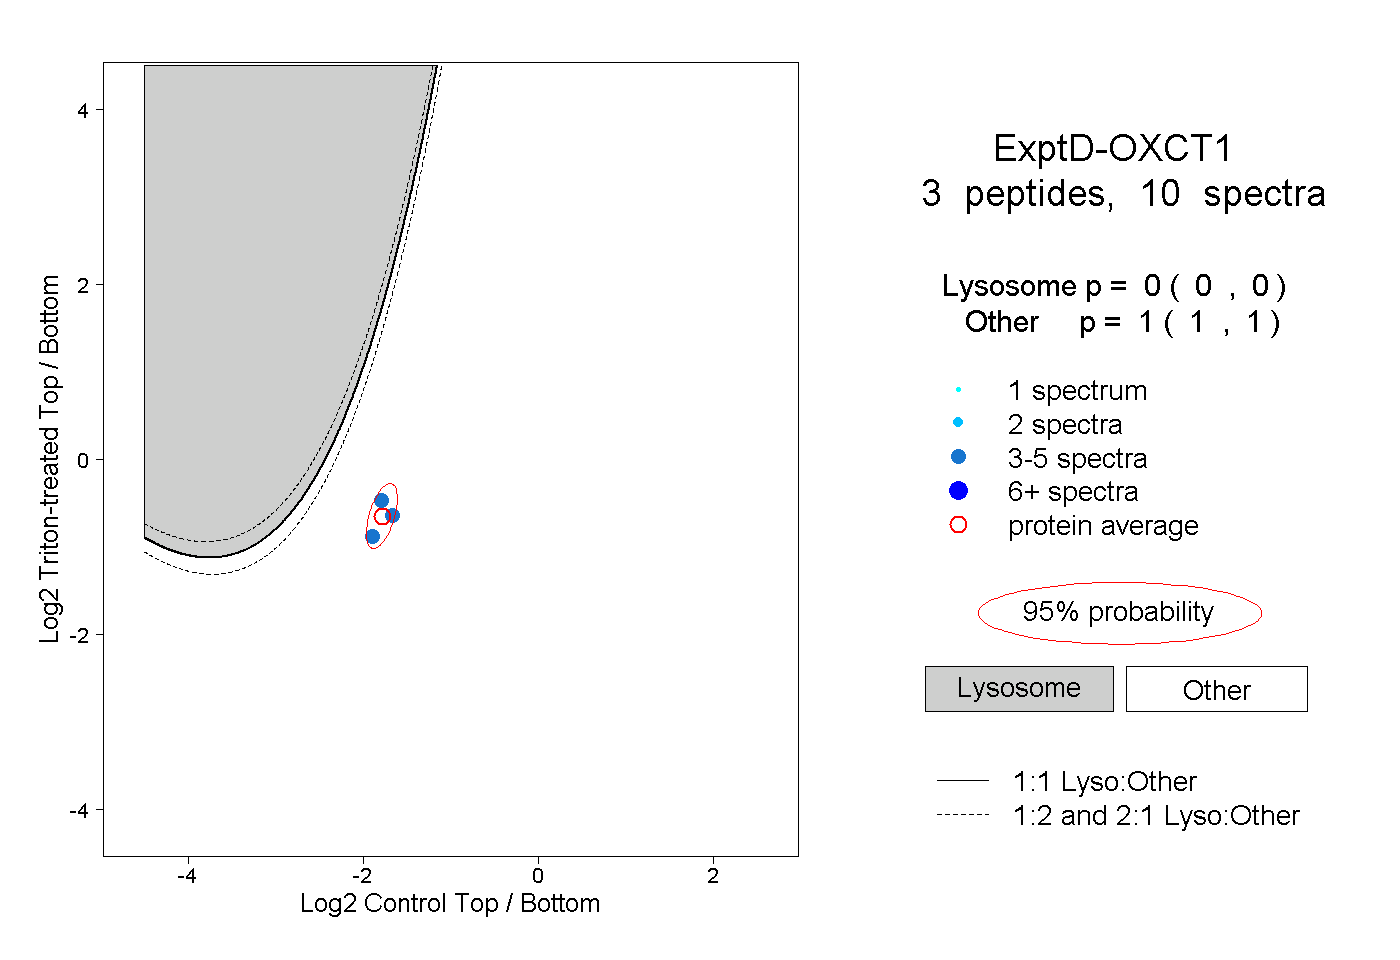
0.000 | 0.000
1.000 | 1.000