 9
9peptides
spectra
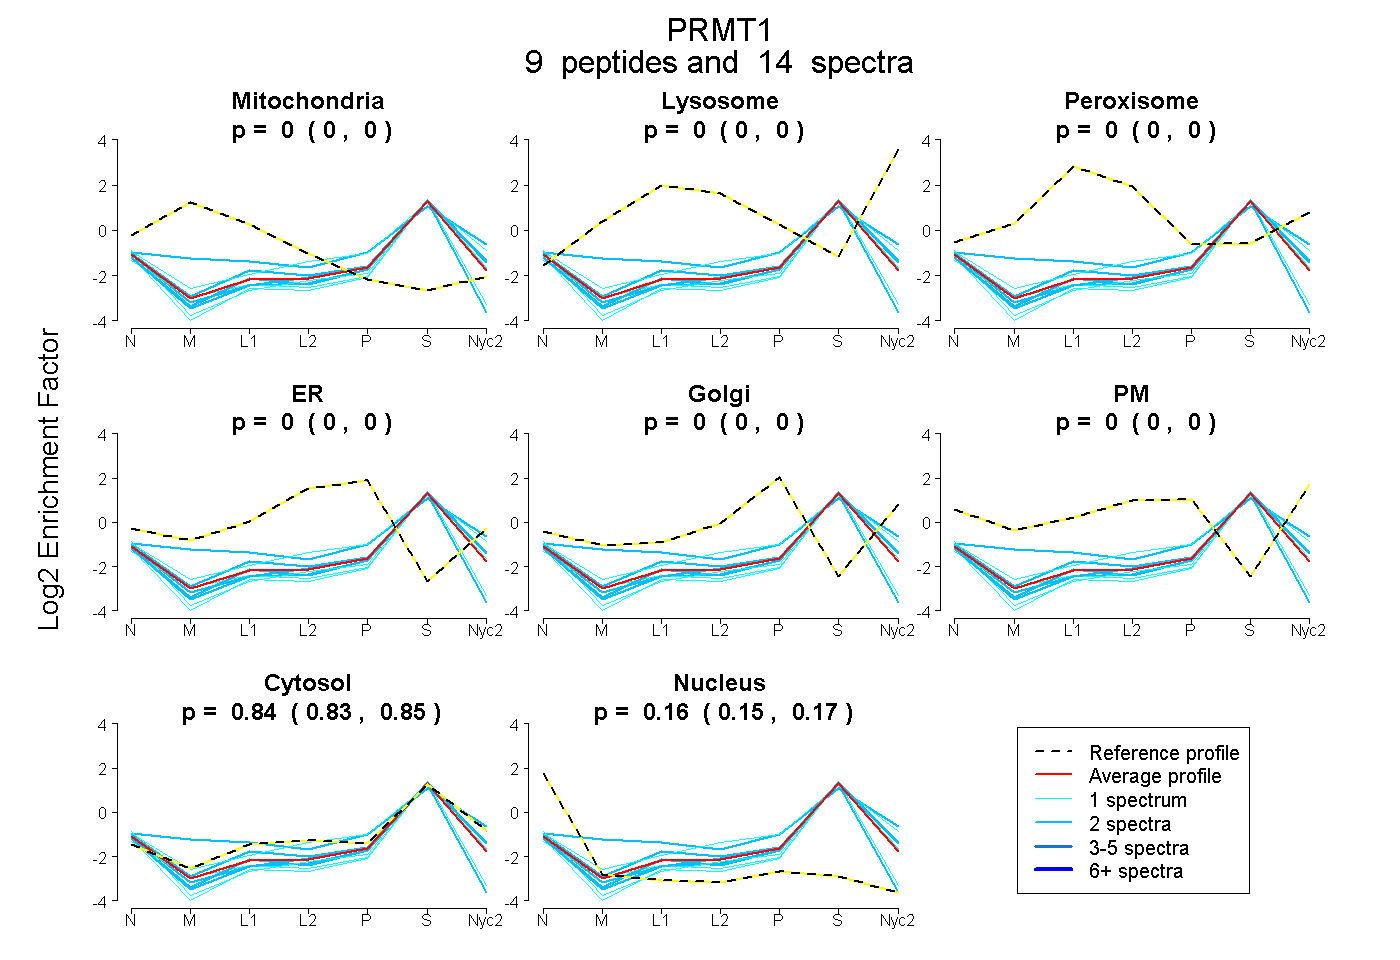
0.000 | 0.000
0.000 | 0.000
0.000 | 0.000
0.000 | 0.000
0.000 | 0.000
0.000 | 0.000
0.830 | 0.853
0.145 | 0.168
| Plot | Mito | Lyso | Perox | ER | Golgi | PM | Cytosol | Nucleus | |||||
| Expt A |
9 peptides |
14 spectra |
|
0.000 0.000 | 0.000 |
0.000 0.000 | 0.000 |
0.000 0.000 | 0.000 |
0.000 0.000 | 0.000 |
0.000 0.000 | 0.000 |
0.000 0.000 | 0.000 |
0.842 0.830 | 0.853 |
0.158 0.145 | 0.168 |
| 1 spectrum, VEEVELPVEK | 0.000 | 0.000 | 0.000 | 0.000 | 0.000 | 0.000 | 0.802 | 0.198 | ||
| 2 spectra, QLVTNACLIK | 0.000 | 0.000 | 0.000 | 0.000 | 0.000 | 0.000 | 0.735 | 0.265 | ||
| 2 spectra, EVDIYTVK | 0.000 | 0.000 | 0.000 | 0.000 | 0.000 | 0.000 | 0.867 | 0.133 | ||
| 2 spectra, WLAPDGLIFPDR | 0.000 | 0.000 | 0.000 | 0.000 | 0.000 | 0.000 | 0.872 | 0.128 | ||
| 1 spectrum, EPLVDVVDPK | 0.000 | 0.000 | 0.000 | 0.000 | 0.000 | 0.000 | 0.832 | 0.168 | ||
| 1 spectrum, GQLCELSCSTDYR | 0.000 | 0.000 | 0.000 | 0.000 | 0.000 | 0.000 | 0.700 | 0.300 | ||
| 2 spectra, ATLYVTAIEDR | 0.000 | 0.000 | 0.000 | 0.000 | 0.000 | 0.000 | 0.844 | 0.156 | ||
| 2 spectra, LDHVVTIIK | 0.124 | 0.013 | 0.000 | 0.000 | 0.053 | 0.000 | 0.810 | 0.000 | ||
| 1 spectrum, TGEEIFGTIGMRPNAK | 0.000 | 0.000 | 0.000 | 0.000 | 0.033 | 0.000 | 0.915 | 0.051 |
| Plot | Mito | Lyso or Perox | ER | Golgi | PM | Cytosol | Nucleus | ||||||
| Expt B |
1 peptide |
2 spectra |
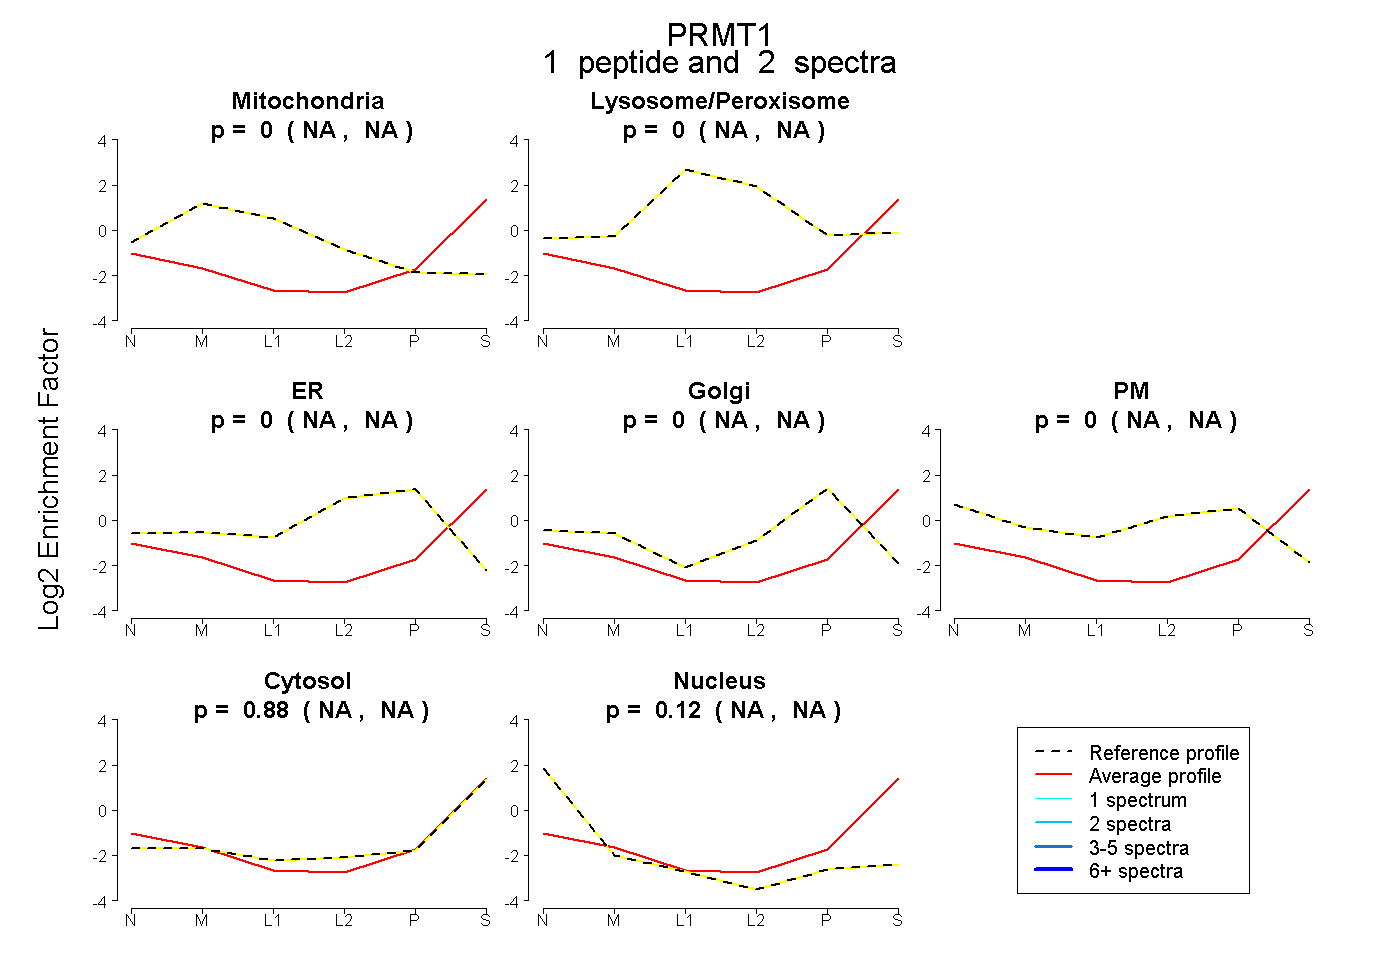 |
0.000 NA | NA |
0.000 NA | NA |
0.000 NA | NA |
0.000 NA | NA |
0.000 NA | NA |
0.883 NA | NA |
0.117 NA | NA |
|||
| Plot | Lyso | Other | |||||||||||
| Expt C |
1 peptide |
1 spectrum |
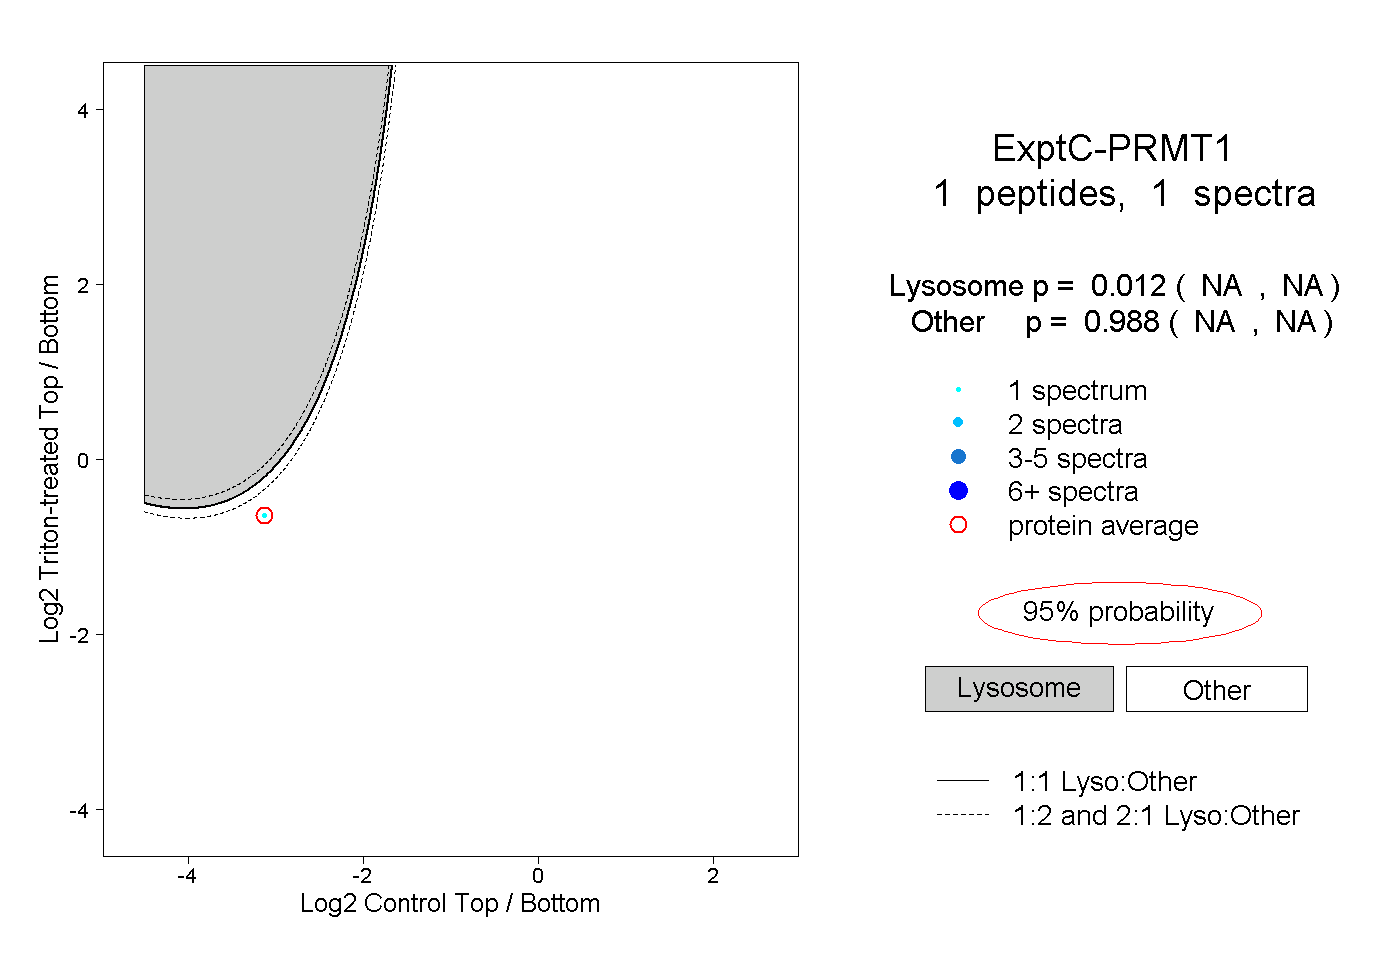 |
0.012 NA | NA |
0.988 NA | NA |