 4
4peptides
spectra
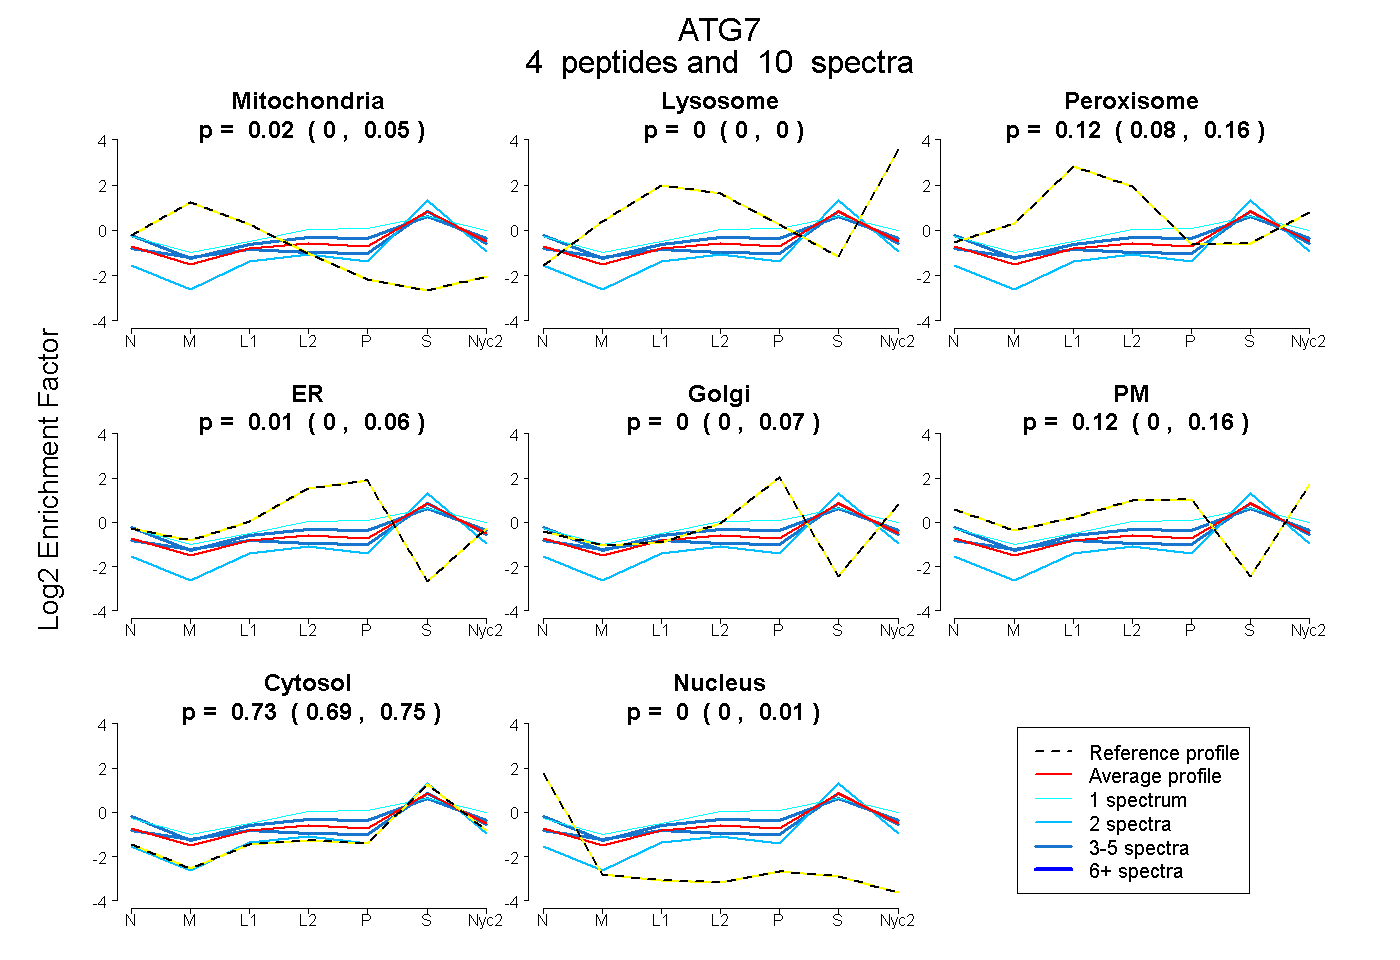
0.000 | 0.047
0.000 | 0.000
0.080 | 0.158
0.000 | 0.063
0.000 | 0.074
0.001 | 0.156
0.694 | 0.749
0.000 | 0.008
2peptides
spectra
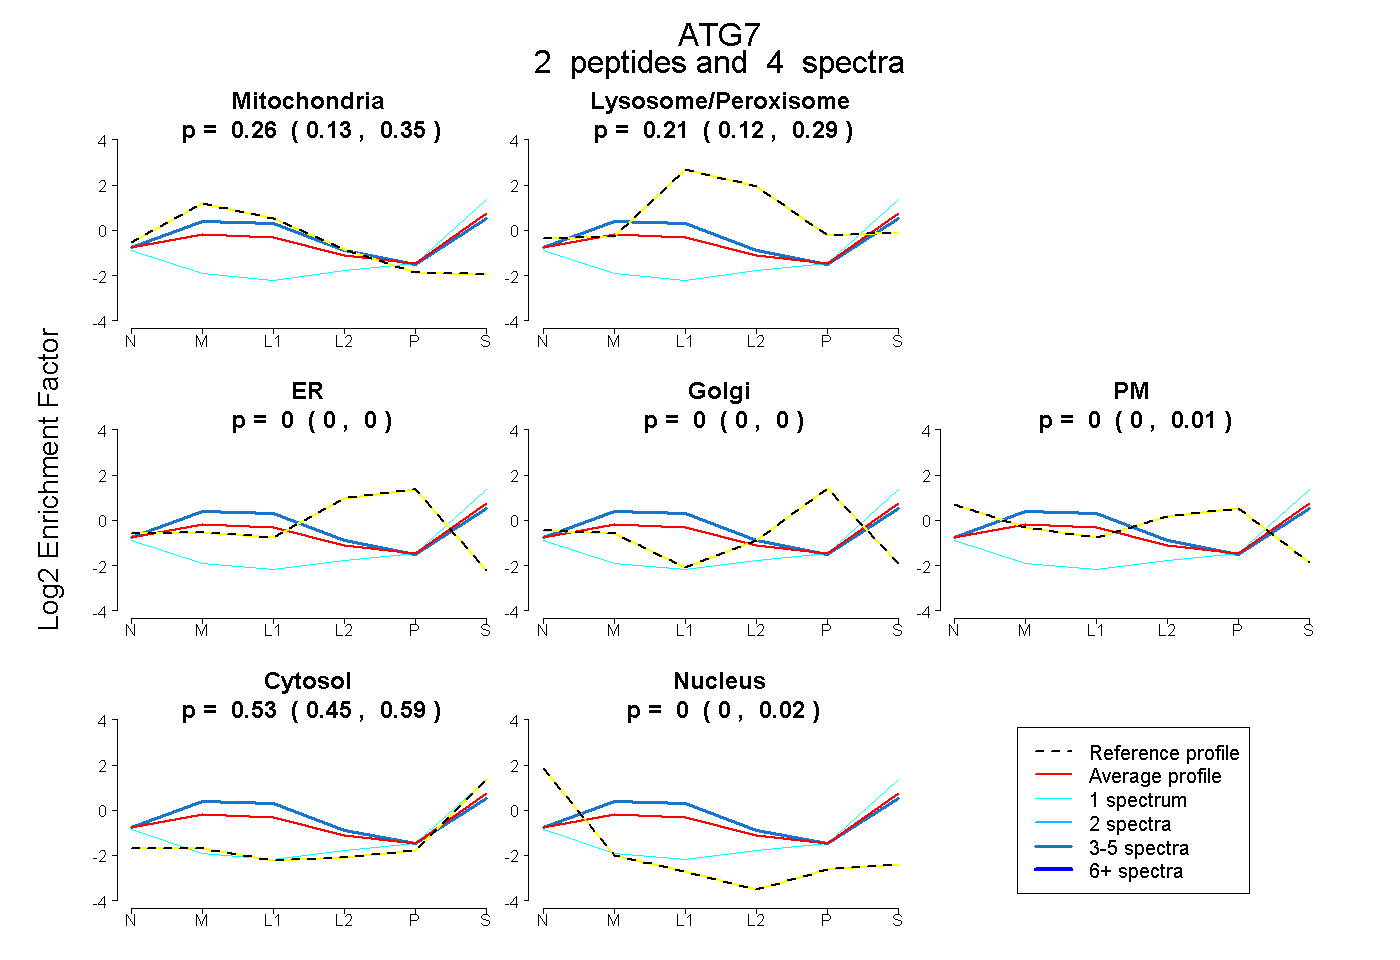
0.129 | 0.345
0.123 | 0.287
0.000 | 0.000
0.000 | 0.000
0.000 | 0.007
0.450 | 0.588
0.000 | 0.024
4peptides
spectra
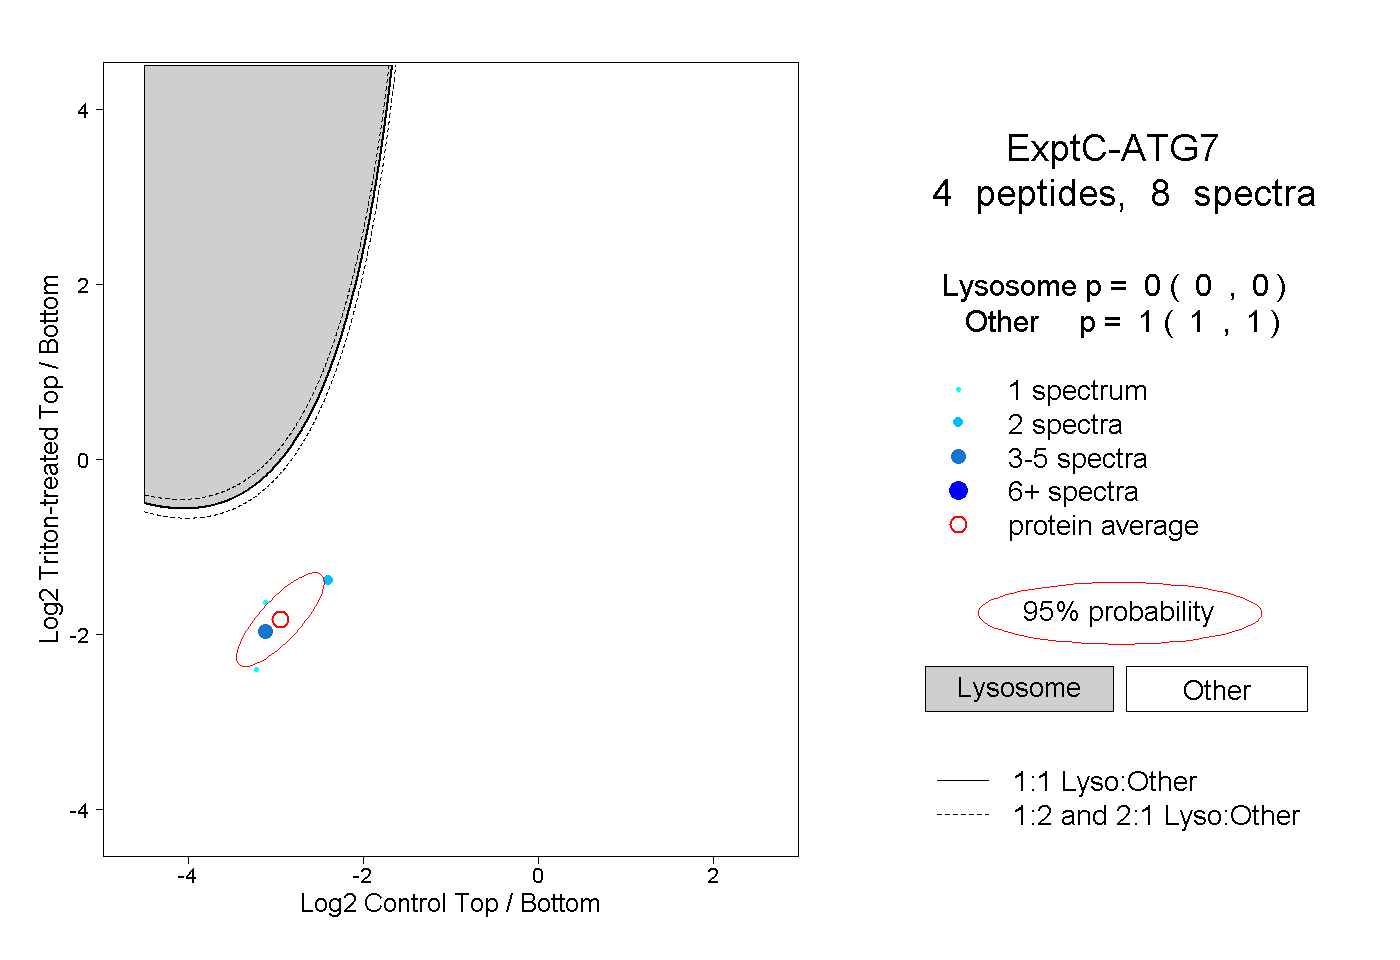
0.000 | 0.000
1.000 | 1.000