 17
17peptides
spectra
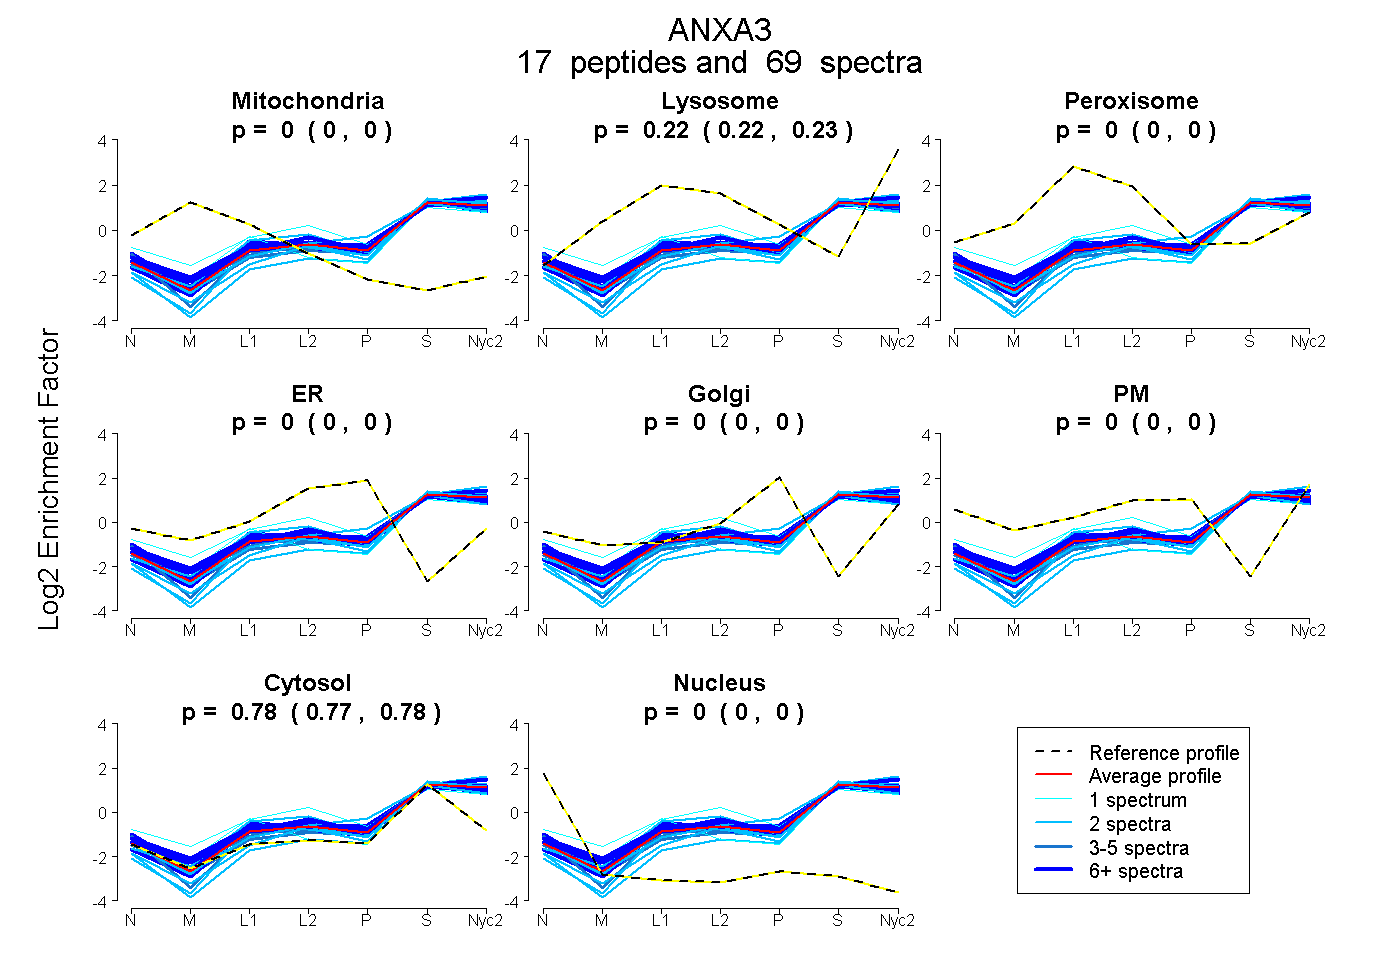
0.000 | 0.000
0.222 | 0.226
0.000 | 0.000
0.000 | 0.000
0.000 | 0.000
0.000 | 0.000
0.774 | 0.778
0.000 | 0.000
5peptides
spectra
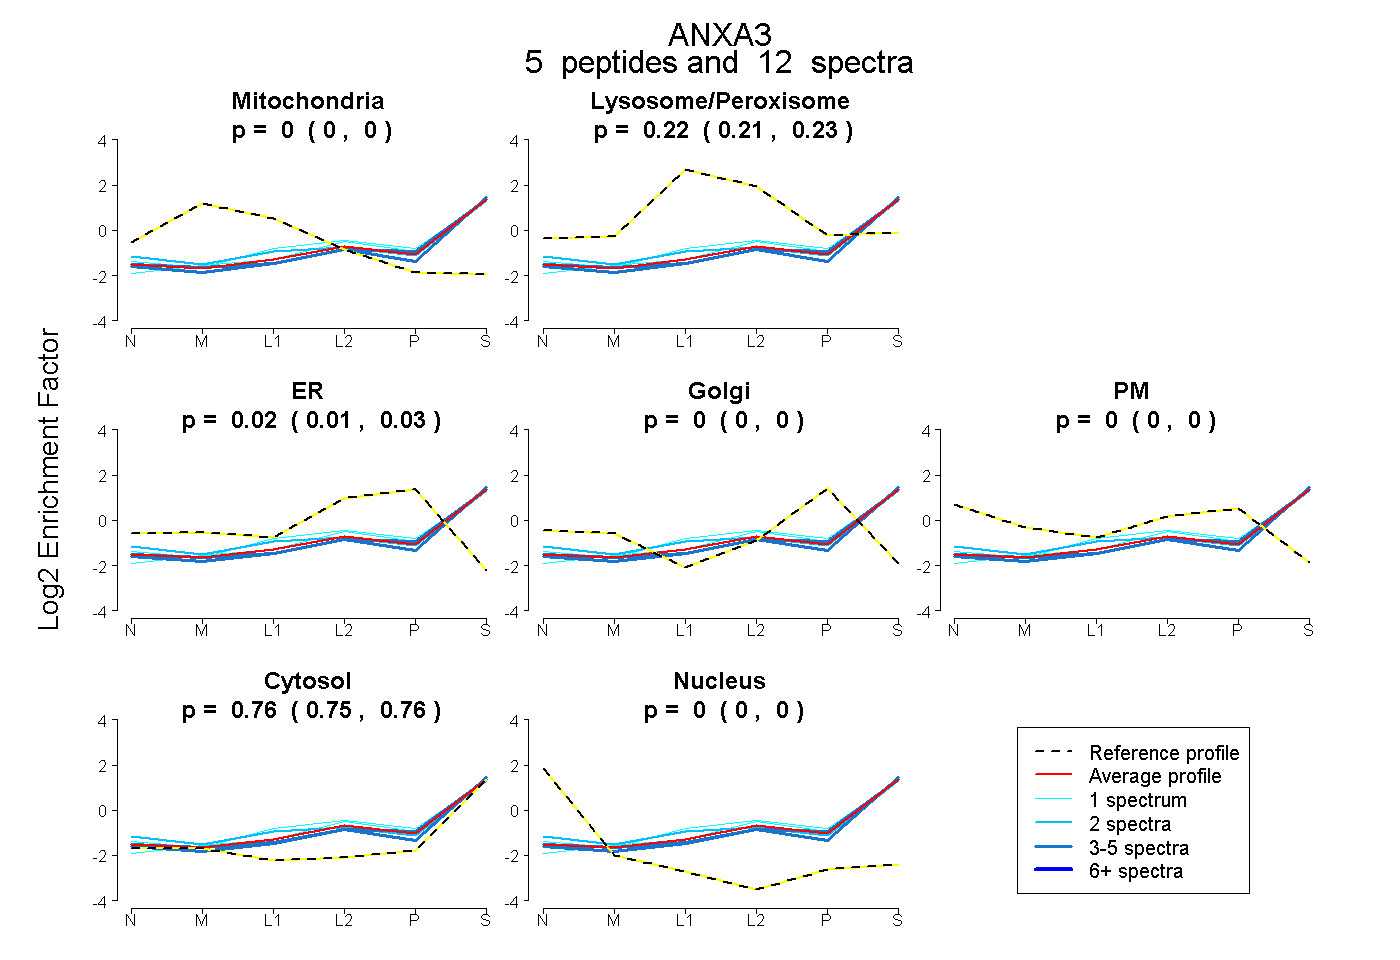
0.000 | 0.000
0.206 | 0.232
0.011 | 0.034
0.000 | 0.000
0.000 | 0.000
0.748 | 0.763
0.000 | 0.000
15peptides
spectra
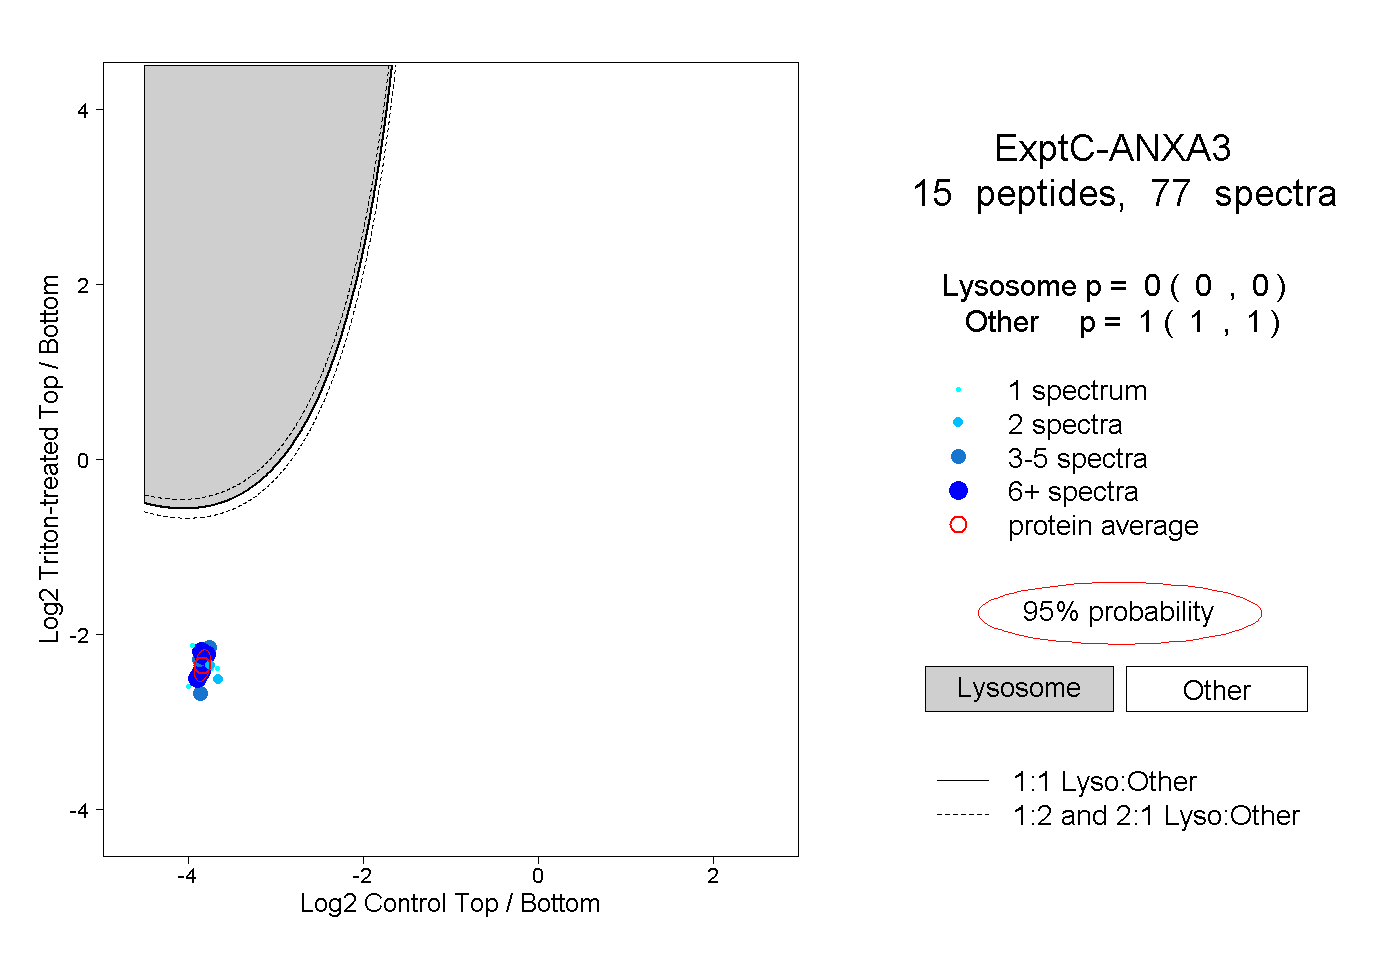
0.000 | 0.000
1.000 | 1.000
3peptides
spectra
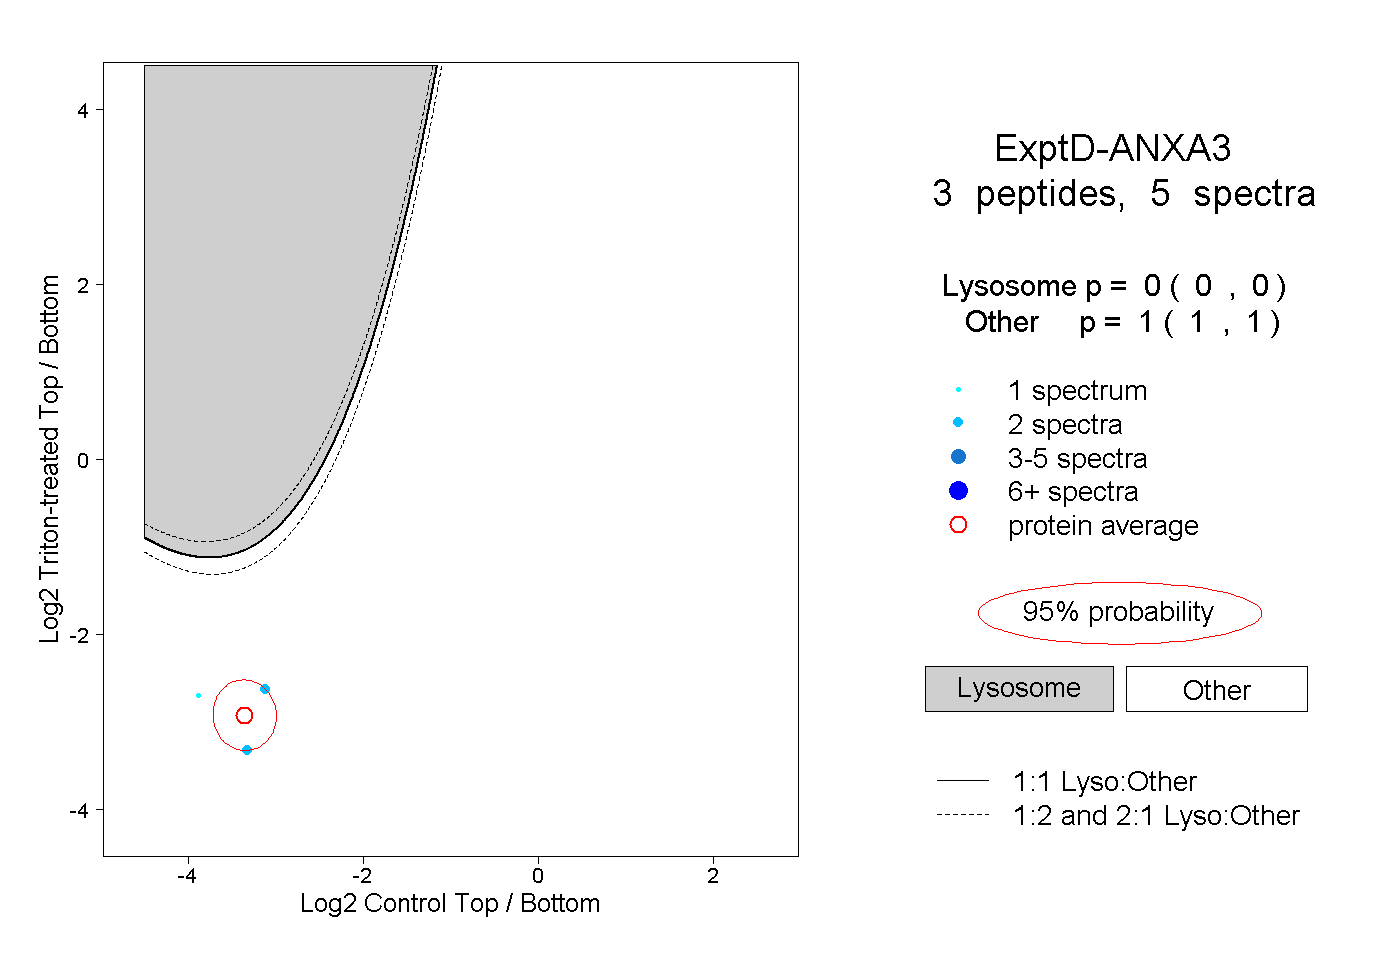
0.000 | 0.000
1.000 | 1.000