 11
11peptides
spectra
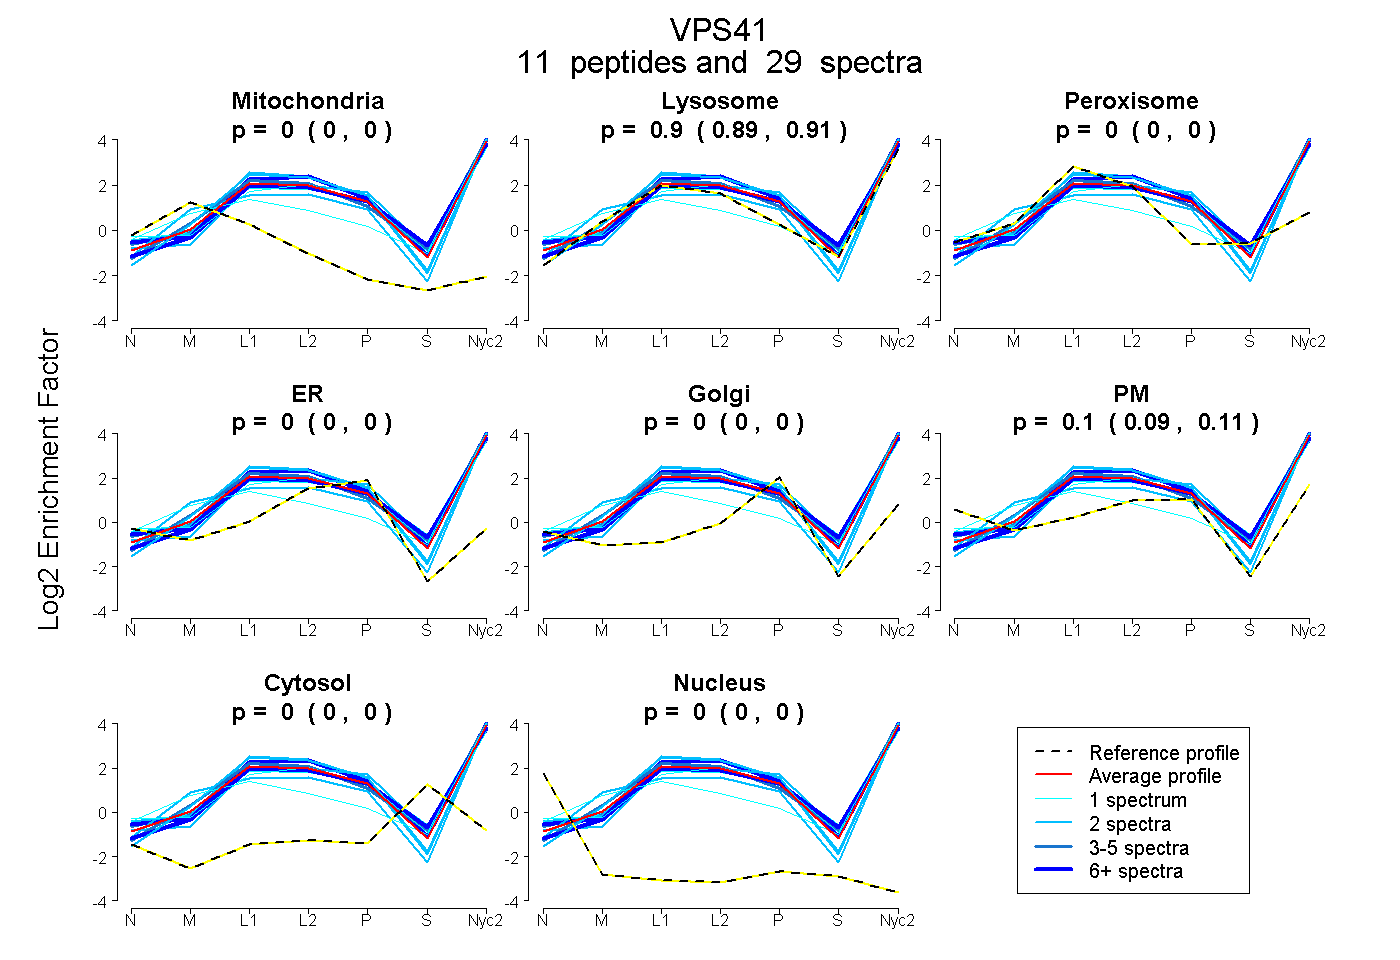
0.000 | 0.000
0.892 | 0.911
0.000 | 0.000
0.000 | 0.000
0.000 | 0.000
0.087 | 0.106
0.000 | 0.000
0.000 | 0.000
3peptides
spectra
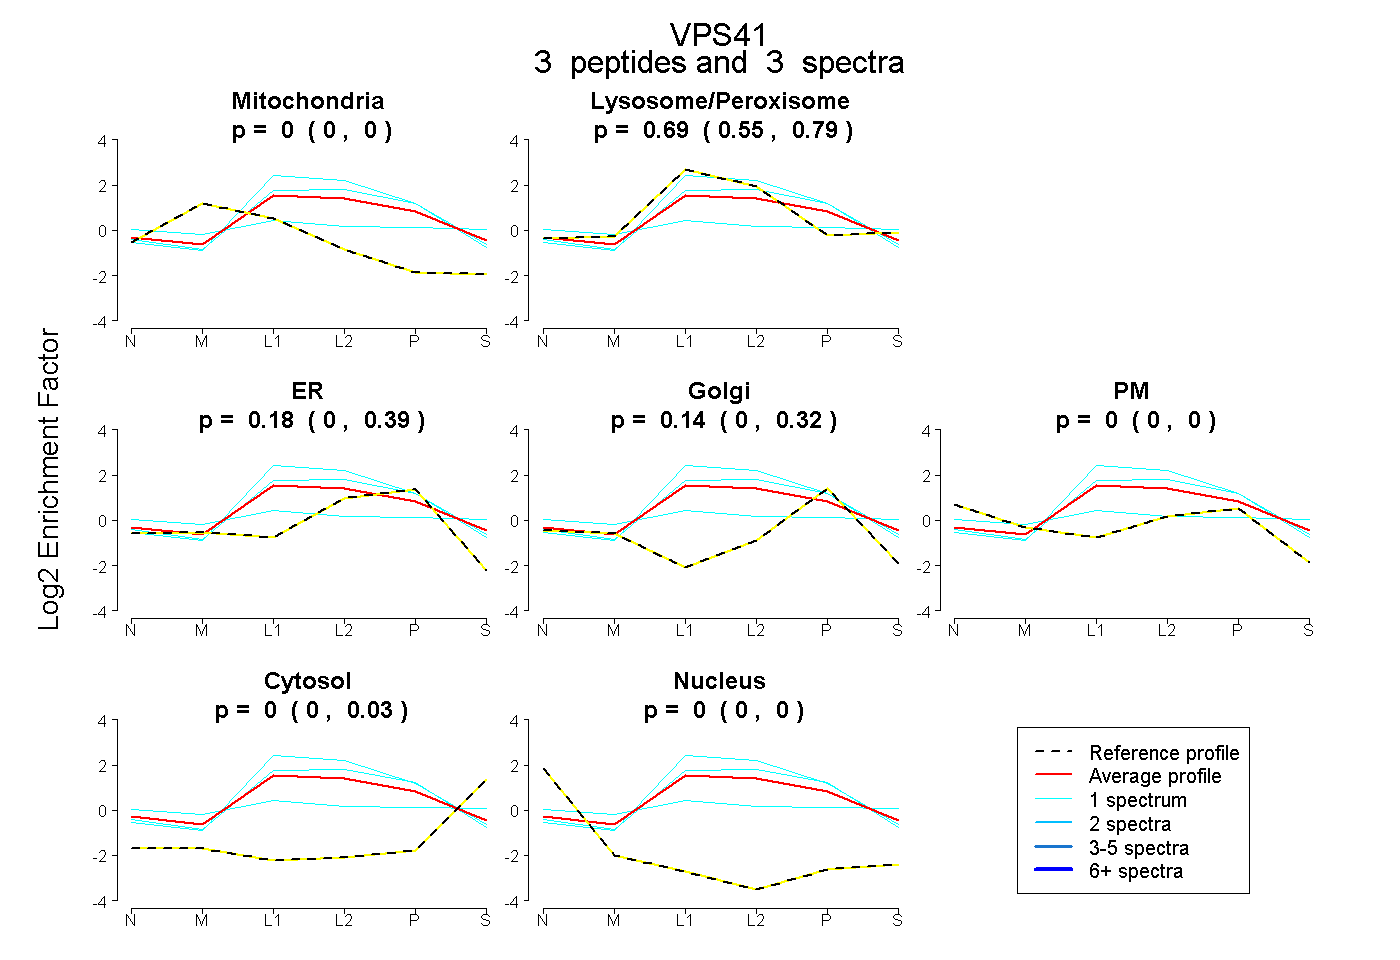
0.000 | 0.000
0.546 | 0.790
0.000 | 0.390
0.000 | 0.318
0.000 | 0.000
0.000 | 0.034
0.000 | 0.000
22peptides
spectra
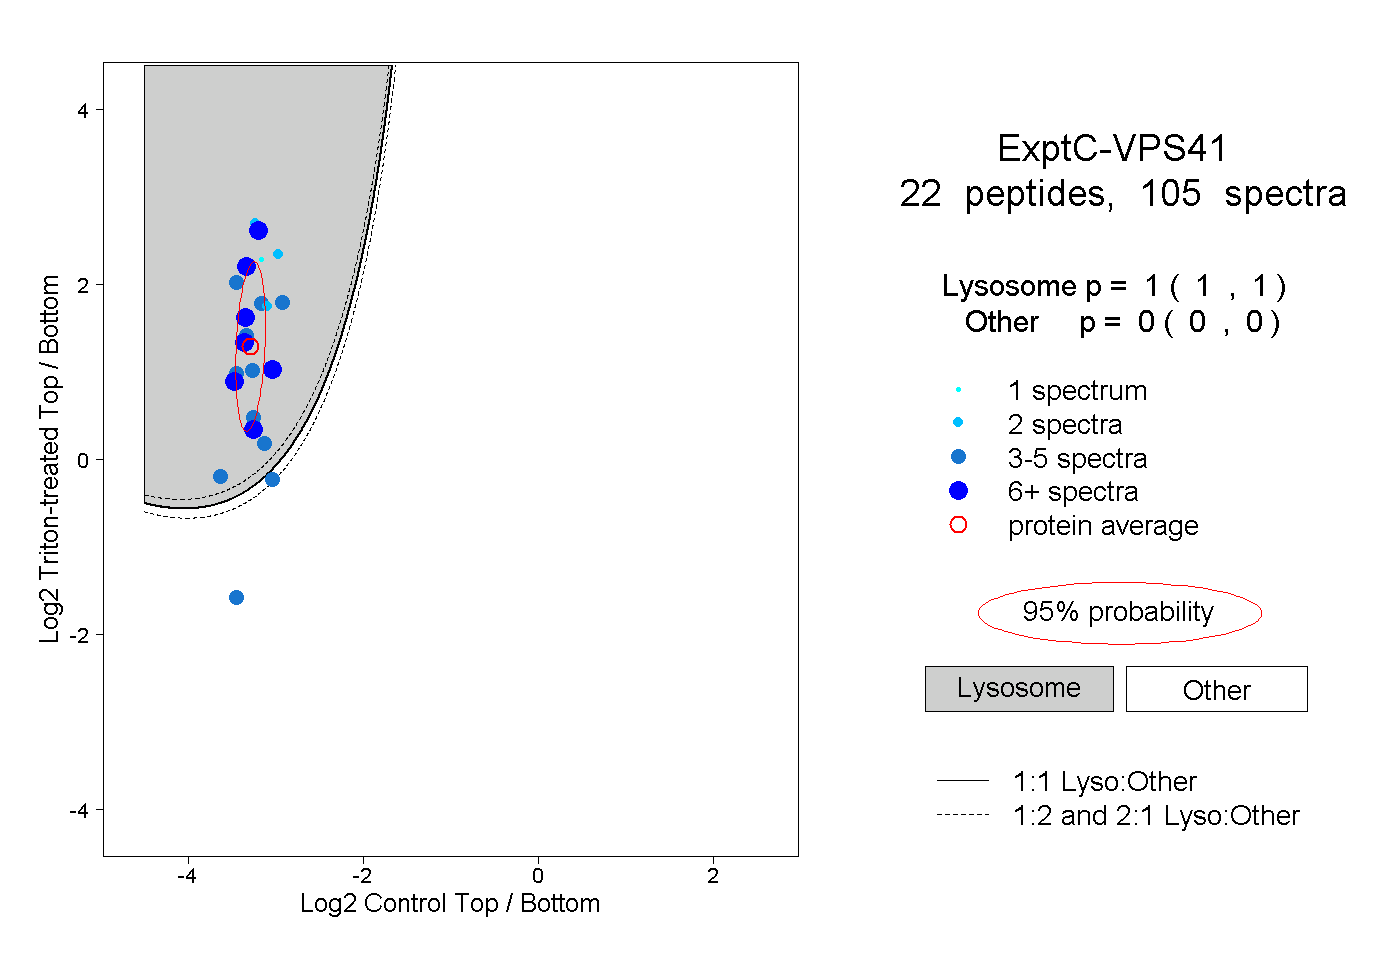
1.000 | 1.000
0.000 | 0.000
3peptides
spectra
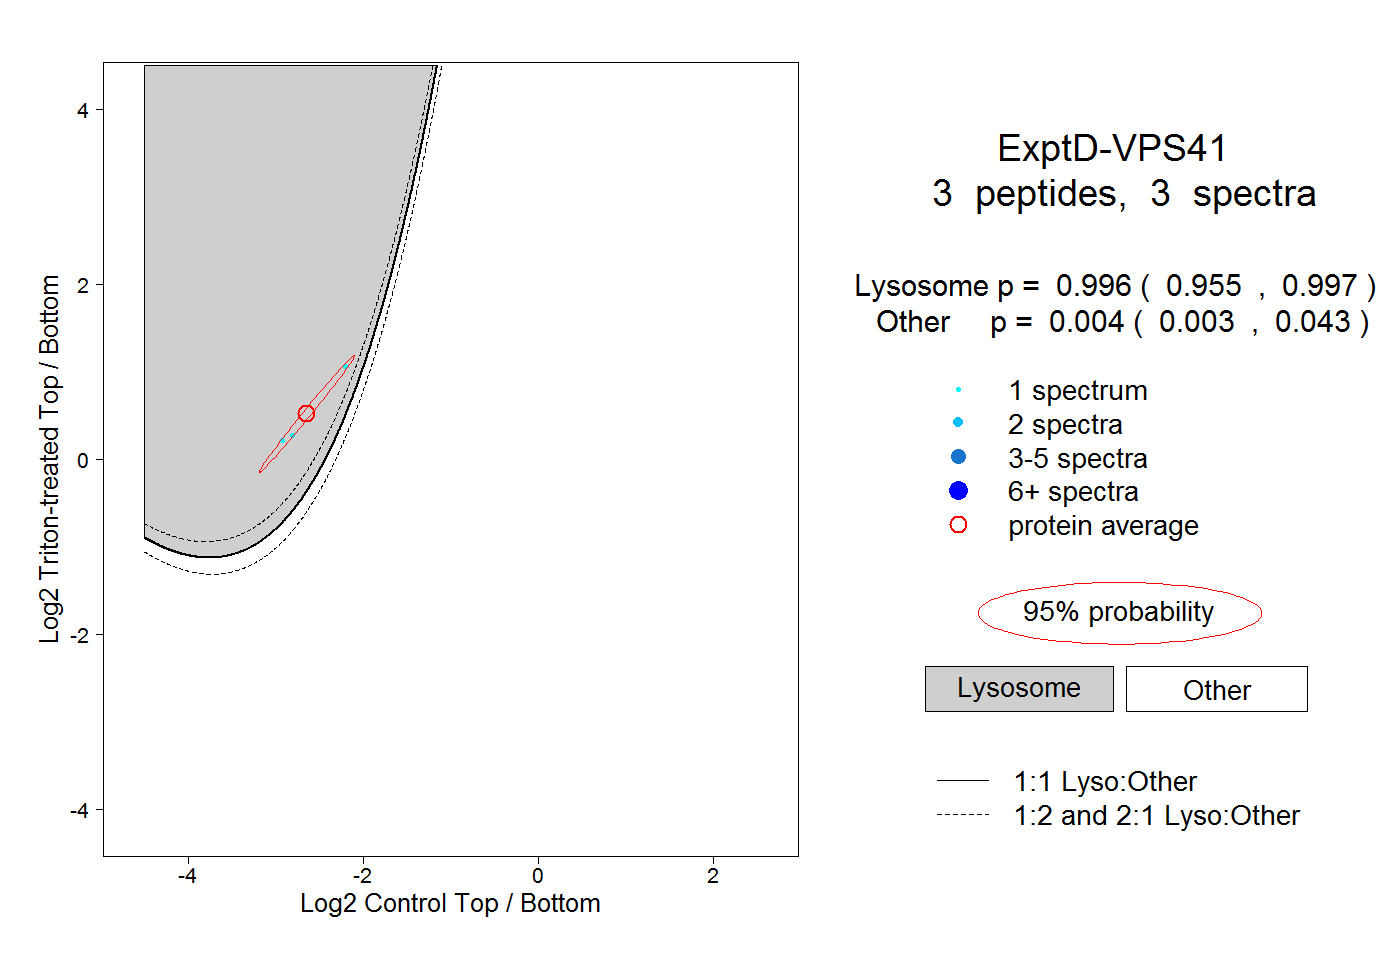
0.955 | 0.997
0.003 | 0.043