 12
12peptides
spectra
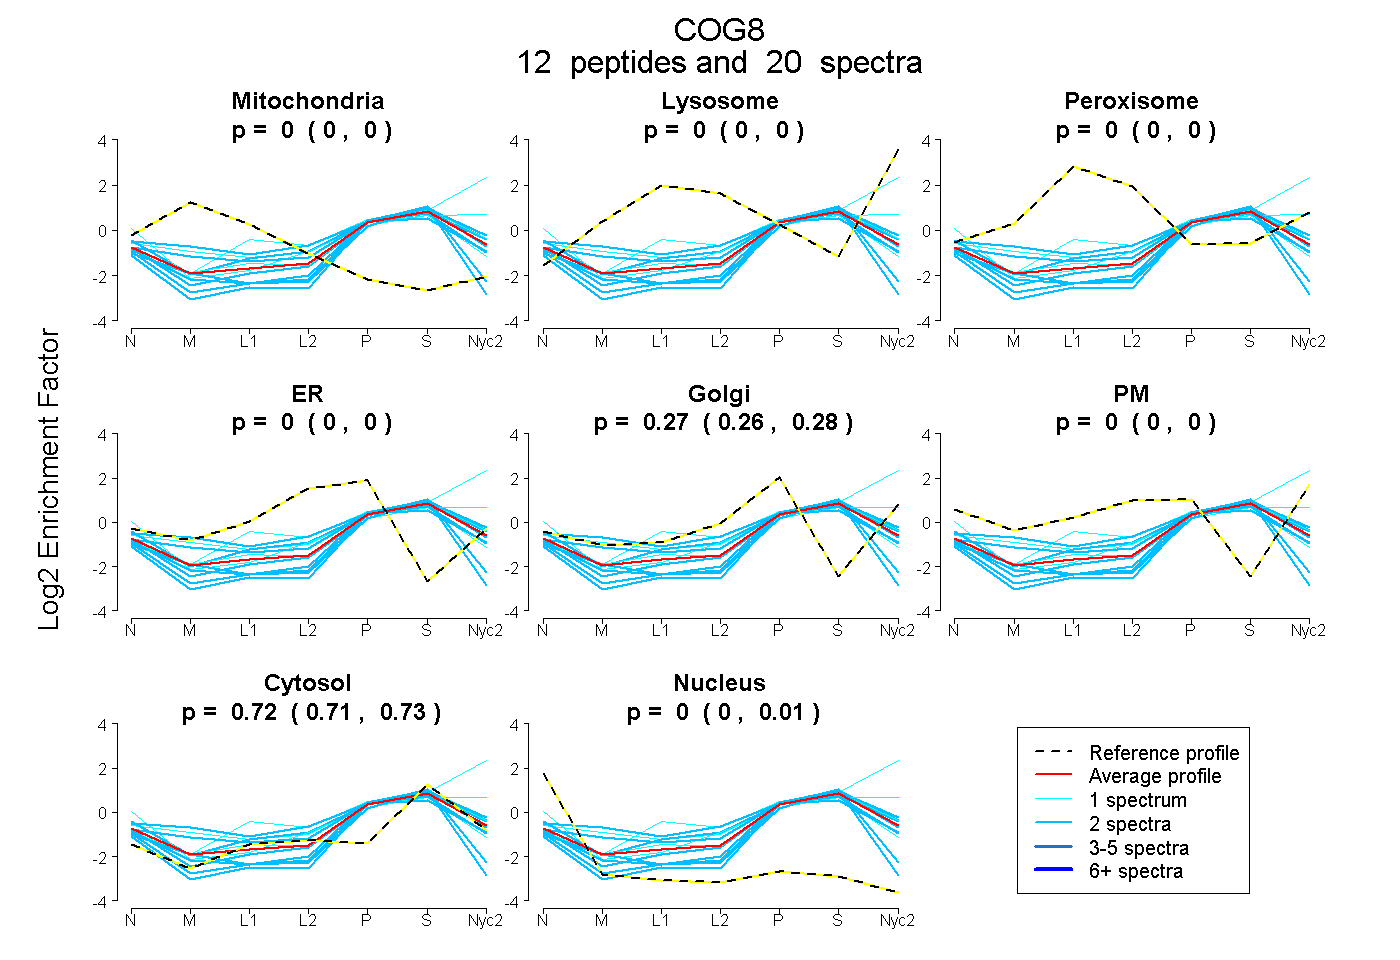
0.000 | 0.000
0.000 | 0.000
0.000 | 0.000
0.000 | 0.000
0.262 | 0.283
0.000 | 0.000
0.715 | 0.728
0.000 | 0.012
4peptides
spectra
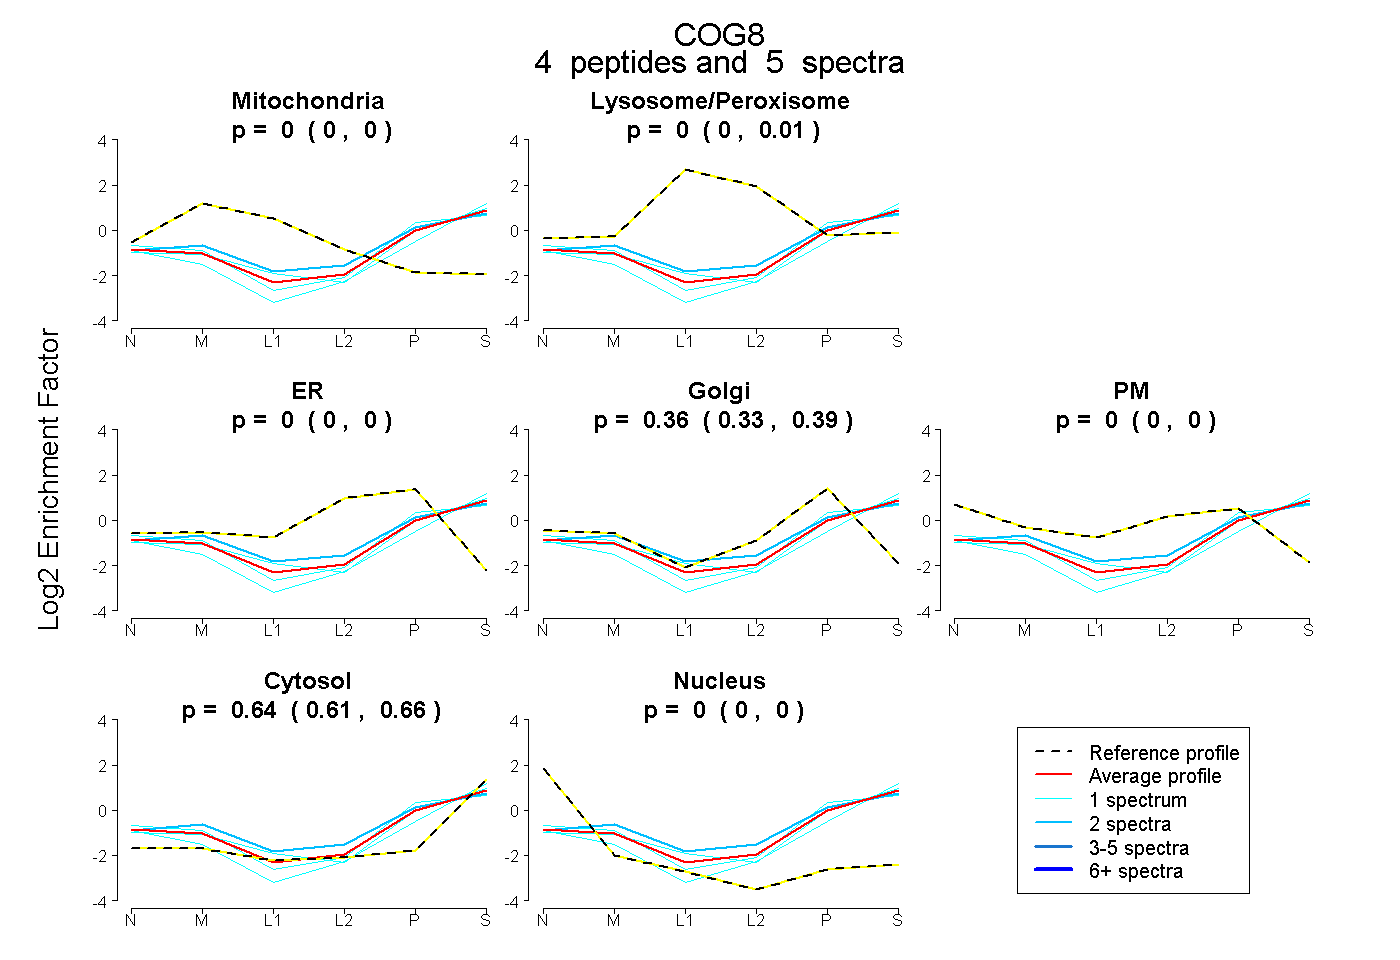
0.000 | 0.000
0.000 | 0.009
0.000 | 0.000
0.334 | 0.386
0.000 | 0.000
0.609 | 0.658
0.000 | 0.000
2peptides
spectra
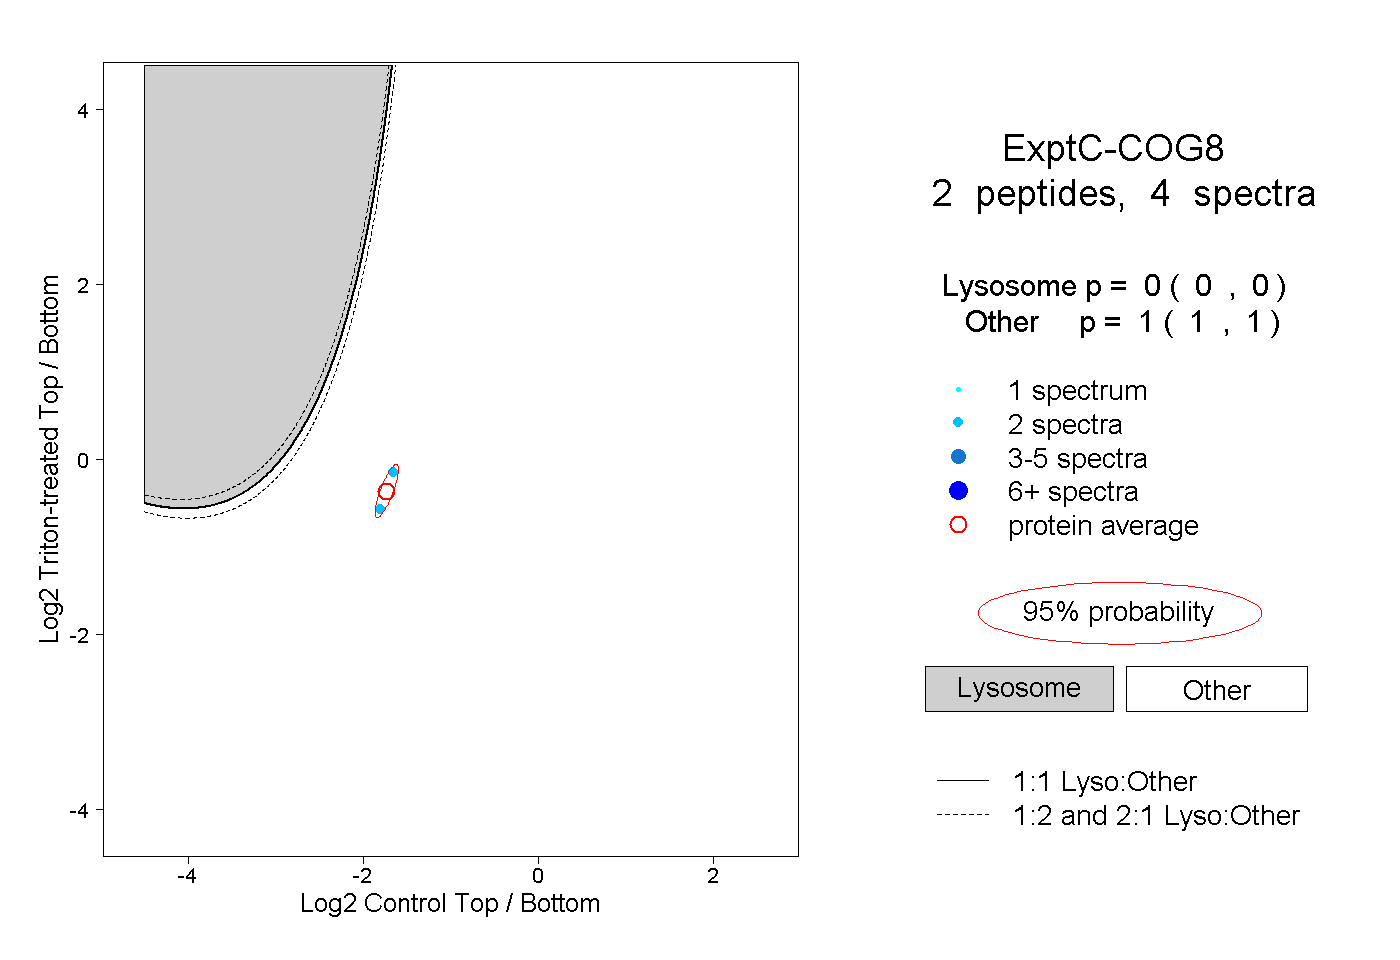
0.000 | 0.000
1.000 | 1.000