COG8
[ENSRNOP00000063394]
Main page
| | | Plot |
Mito |
Lyso |
|
Perox |
ER |
Golgi |
PM |
Cytosol |
Nucleus |
|
| Expt A |
 12
12
peptides |
20
spectra |
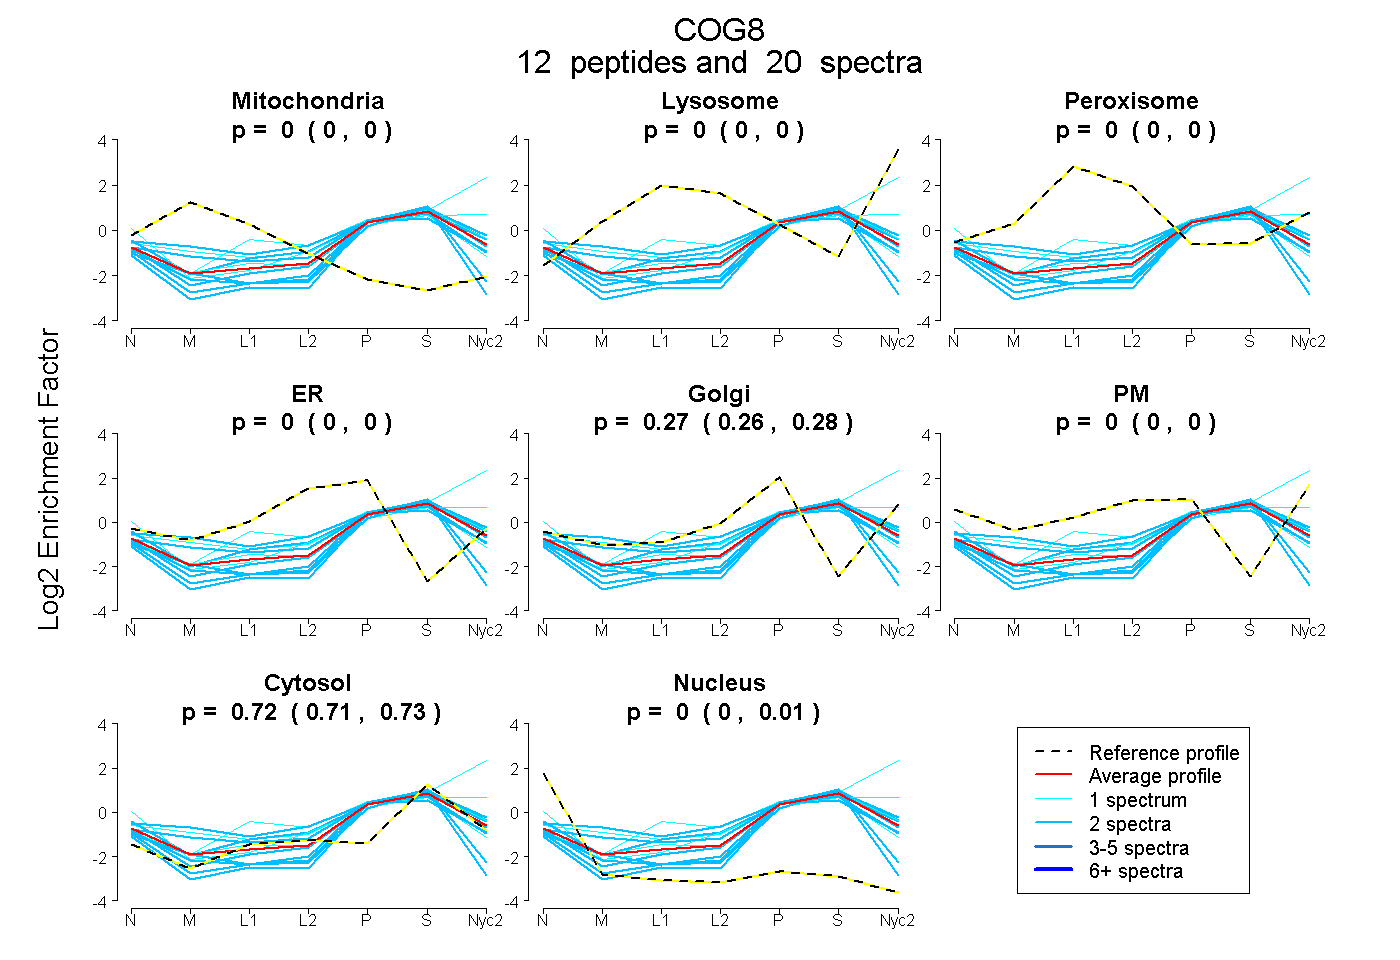 |
0.000
0.000 | 0.000 |
0.000
0.000 | 0.000 |
|
0.000
0.000 | 0.000 |
0.000
0.000 | 0.000 |
0.275
0.262 | 0.283 |
0.000
0.000 | 0.000 |
0.725
0.715 | 0.728 |
0.001
0.000 | 0.012 |
|
| | | Plot |
Mito |
|
Lyso or Perox |
|
ER |
Golgi |
PM |
Cytosol |
Nucleus |
|
| Expt B |
4
peptides |
5
spectra |
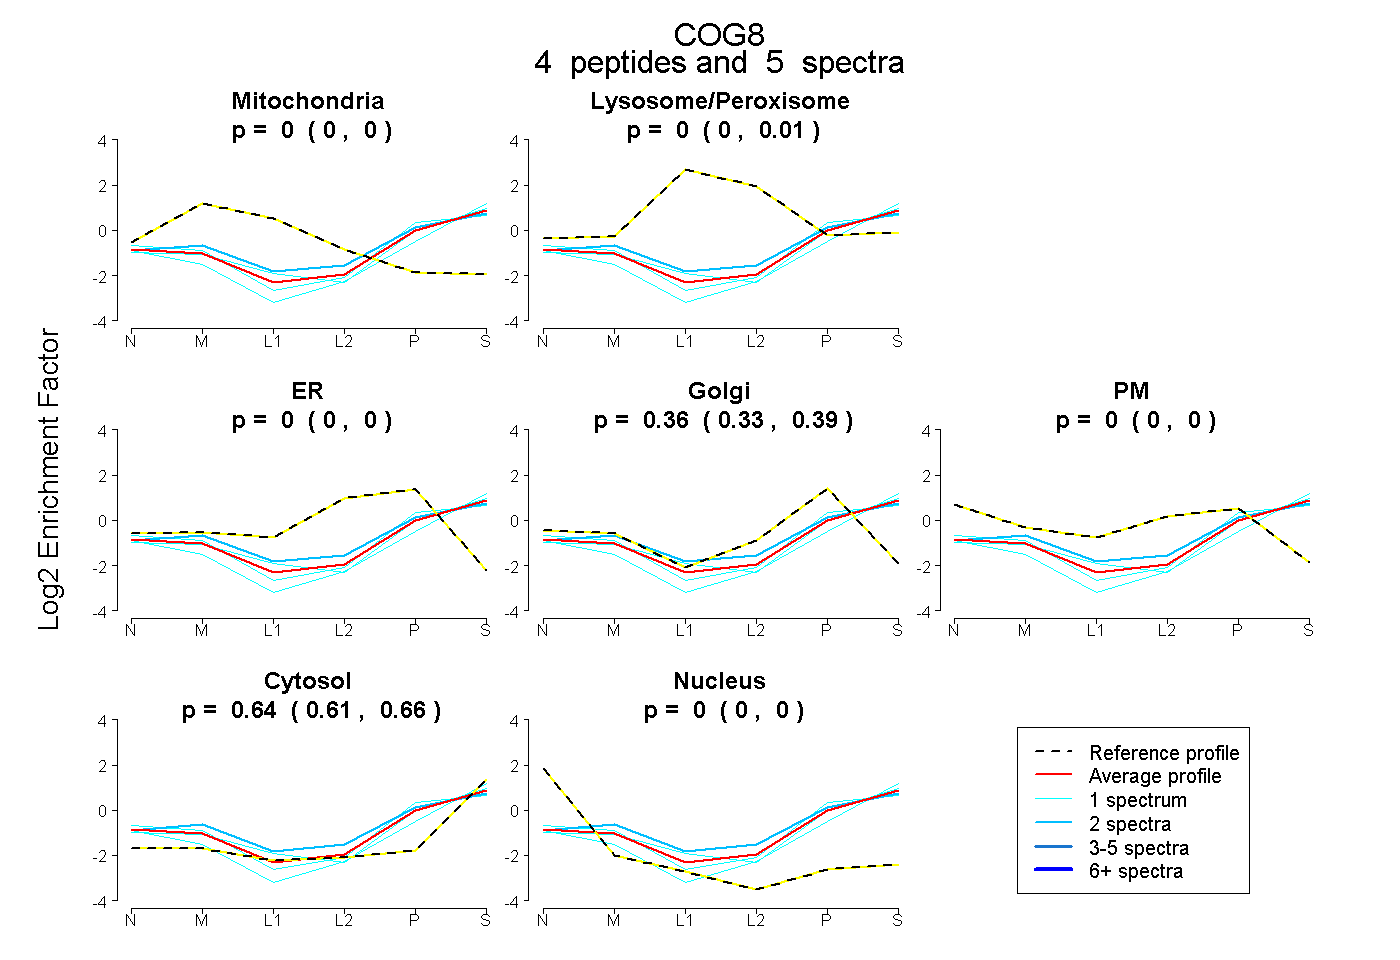 |
0.000
0.000 | 0.000 |
|
0.000
0.000 | 0.009 |
|
0.000
0.000 | 0.000 |
0.363
0.334 | 0.386 |
0.000
0.000 | 0.000 |
0.637
0.609 | 0.658 |
0.000
0.000 | 0.000 |
|
| 1 spectrum, GQLAPVFQR |
0.000 |
|
0.000 |
|
0.000 |
0.210 |
0.000 |
0.766 |
0.025 |
|
| 1 spectrum, EAEEISSNR |
0.000 |
|
0.000 |
|
0.000 |
0.330 |
0.000 |
0.670 |
0.000 |
|
| 1 spectrum, ELSGSGLDR |
0.000 |
|
0.000 |
|
0.000 |
0.446 |
0.000 |
0.554 |
0.000 |
|
| 2 spectra, TILAFHR |
0.000 |
|
0.072 |
|
0.000 |
0.384 |
0.000 |
0.544 |
0.000 |
|
| | | Plot |
|
Lyso |
|
|
|
|
|
|
|
Other |
| Expt C |
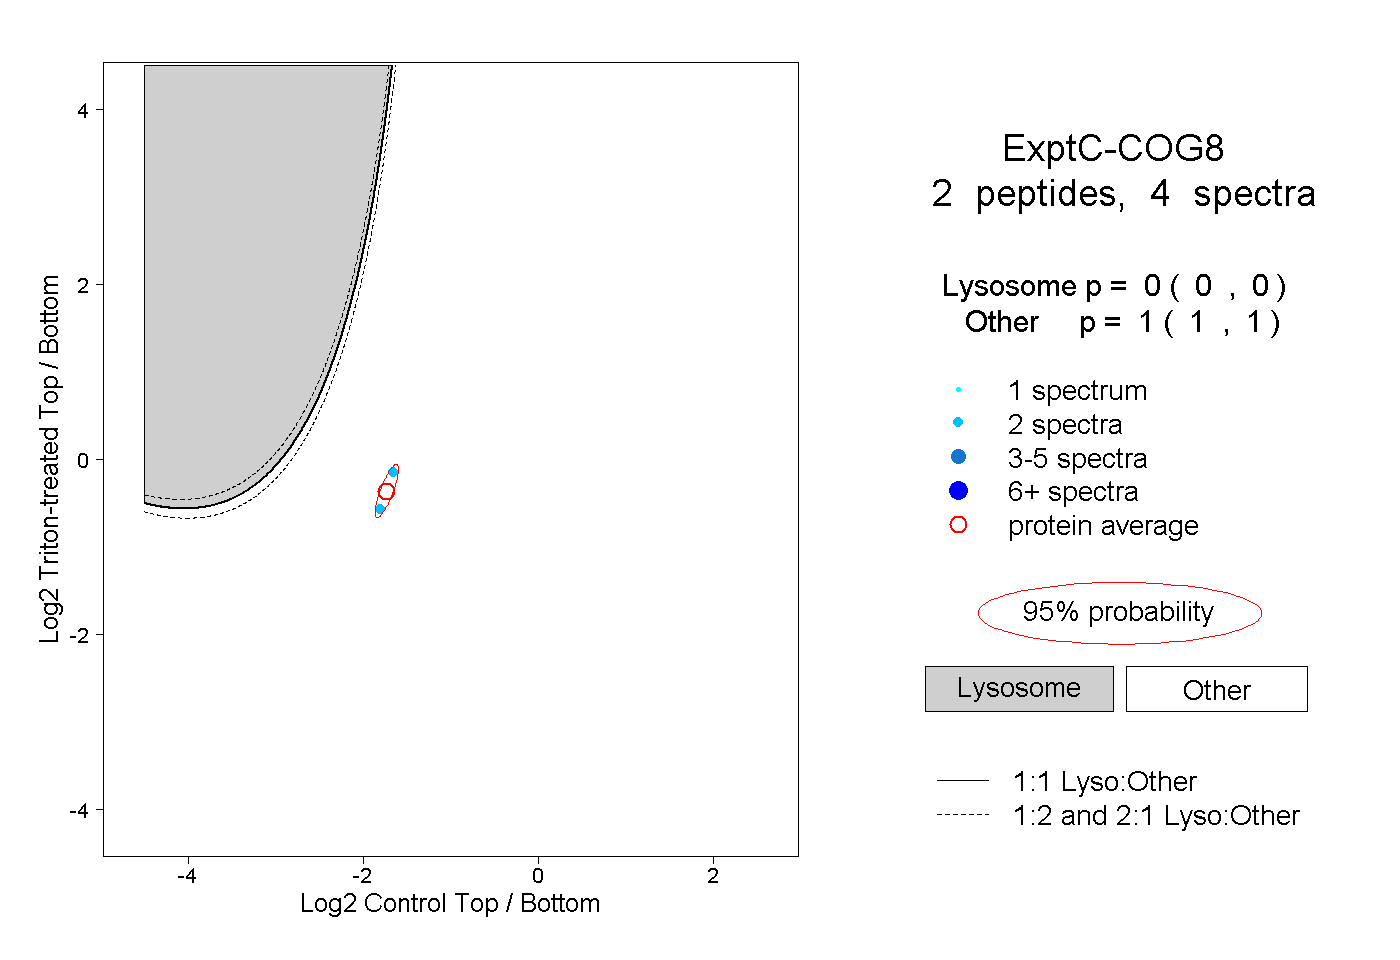
2
peptides |
4
spectra |
 |
|
0.000
0.000 | 0.000 |
|
|
|
|
|
|
|
1.000
1.000 | 1.000 |