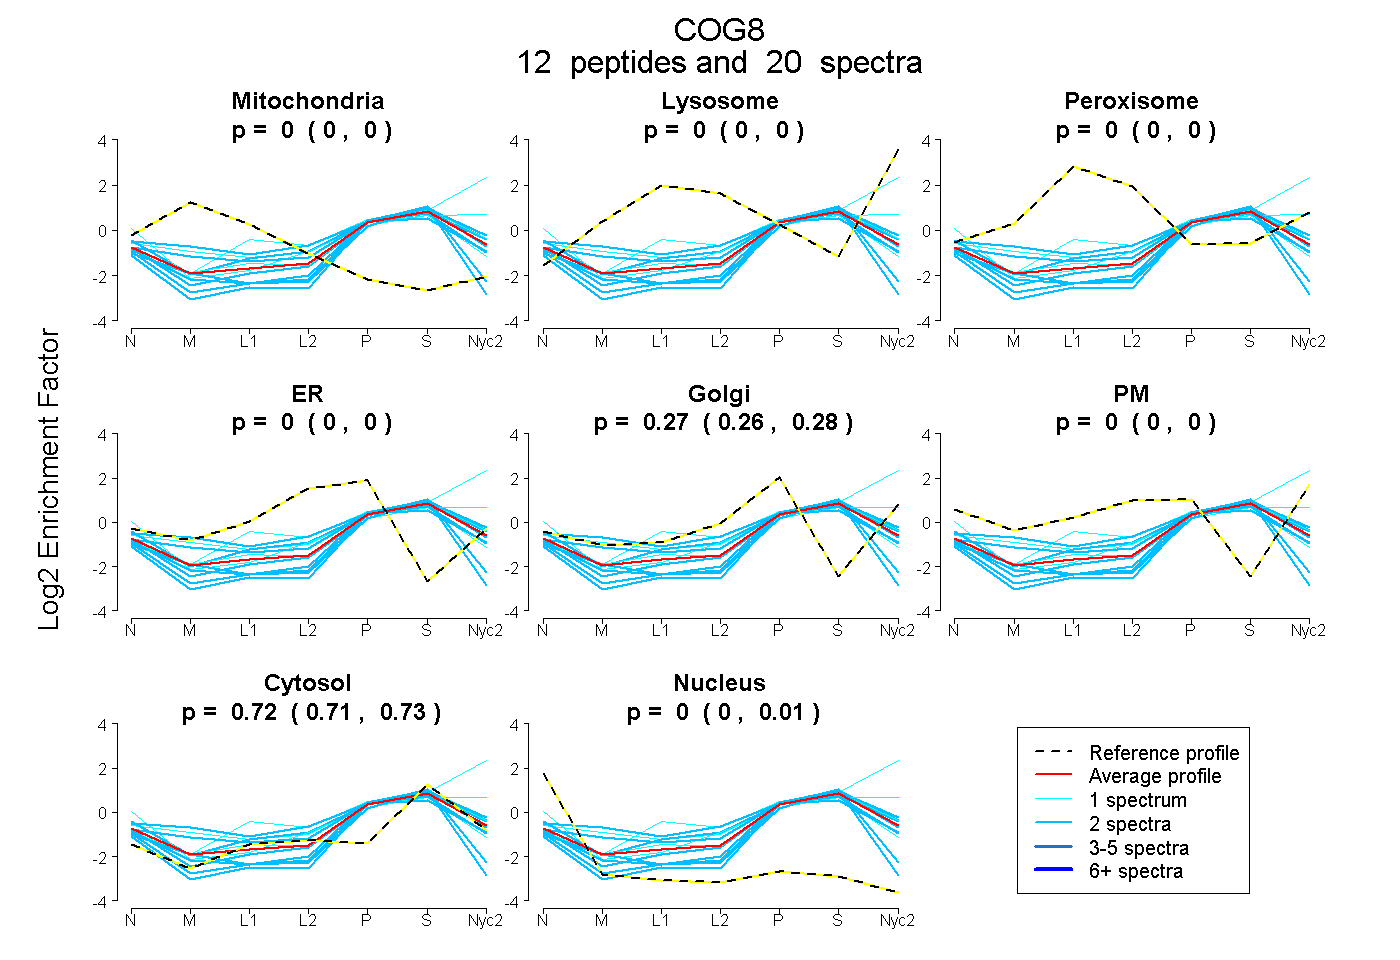
 12
12peptides
spectra
0.000 | 0.000
0.000 | 0.000
0.000 | 0.000
0.000 | 0.000
0.262 | 0.283
0.000 | 0.000
0.715 | 0.728
0.000 | 0.012
| Plot | Mito | Lyso | Perox | ER | Golgi | PM | Cytosol | Nucleus | |||||
| Expt A |
12 peptides |
20 spectra |
|
0.000 0.000 | 0.000 |
0.000 0.000 | 0.000 |
0.000 0.000 | 0.000 |
0.000 0.000 | 0.000 |
0.275 0.262 | 0.283 |
0.000 0.000 | 0.000 |
0.725 0.715 | 0.728 |
0.001 0.000 | 0.012 |
| 2 spectra, GQLAPVFQR | 0.000 | 0.000 | 0.000 | 0.000 | 0.246 | 0.000 | 0.754 | 0.000 | ||
| 1 spectrum, MNTLTLNR | 0.000 | 0.000 | 0.000 | 0.000 | 0.280 | 0.000 | 0.720 | 0.000 | ||
| 1 spectrum, AQLLQQTR | 0.000 | 0.381 | 0.000 | 0.000 | 0.111 | 0.000 | 0.508 | 0.000 | ||
| 2 spectra, EKPDVGR | 0.000 | 0.000 | 0.000 | 0.000 | 0.200 | 0.000 | 0.781 | 0.019 | ||
| 2 spectra, TILAFHR | 0.085 | 0.000 | 0.021 | 0.158 | 0.176 | 0.000 | 0.560 | 0.000 | ||
| 2 spectra, VIGYLR | 0.000 | 0.000 | 0.000 | 0.000 | 0.196 | 0.000 | 0.747 | 0.057 | ||
| 2 spectra, VHLFDIITQYR | 0.048 | 0.000 | 0.000 | 0.000 | 0.299 | 0.000 | 0.653 | 0.000 | ||
| 1 spectrum, SLEPIASATLESGSEK | 0.000 | 0.000 | 0.000 | 0.000 | 0.226 | 0.143 | 0.632 | 0.000 | ||
| 2 spectra, TSIQLPACLR | 0.000 | 0.000 | 0.000 | 0.000 | 0.041 | 0.000 | 0.750 | 0.209 | ||
| 2 spectra, ELSGSGLDR | 0.000 | 0.000 | 0.000 | 0.000 | 0.329 | 0.000 | 0.671 | 0.000 | ||
| 1 spectrum, AVEEAVEK | 0.089 | 0.000 | 0.000 | 0.100 | 0.191 | 0.000 | 0.620 | 0.000 | ||
| 2 spectra, LPSFQQSCR | 0.000 | 0.000 | 0.000 | 0.000 | 0.025 | 0.000 | 0.794 | 0.181 |
| Plot | Mito | Lyso or Perox | ER | Golgi | PM | Cytosol | Nucleus | ||||||
| Expt B |
4 peptides |
5 spectra |
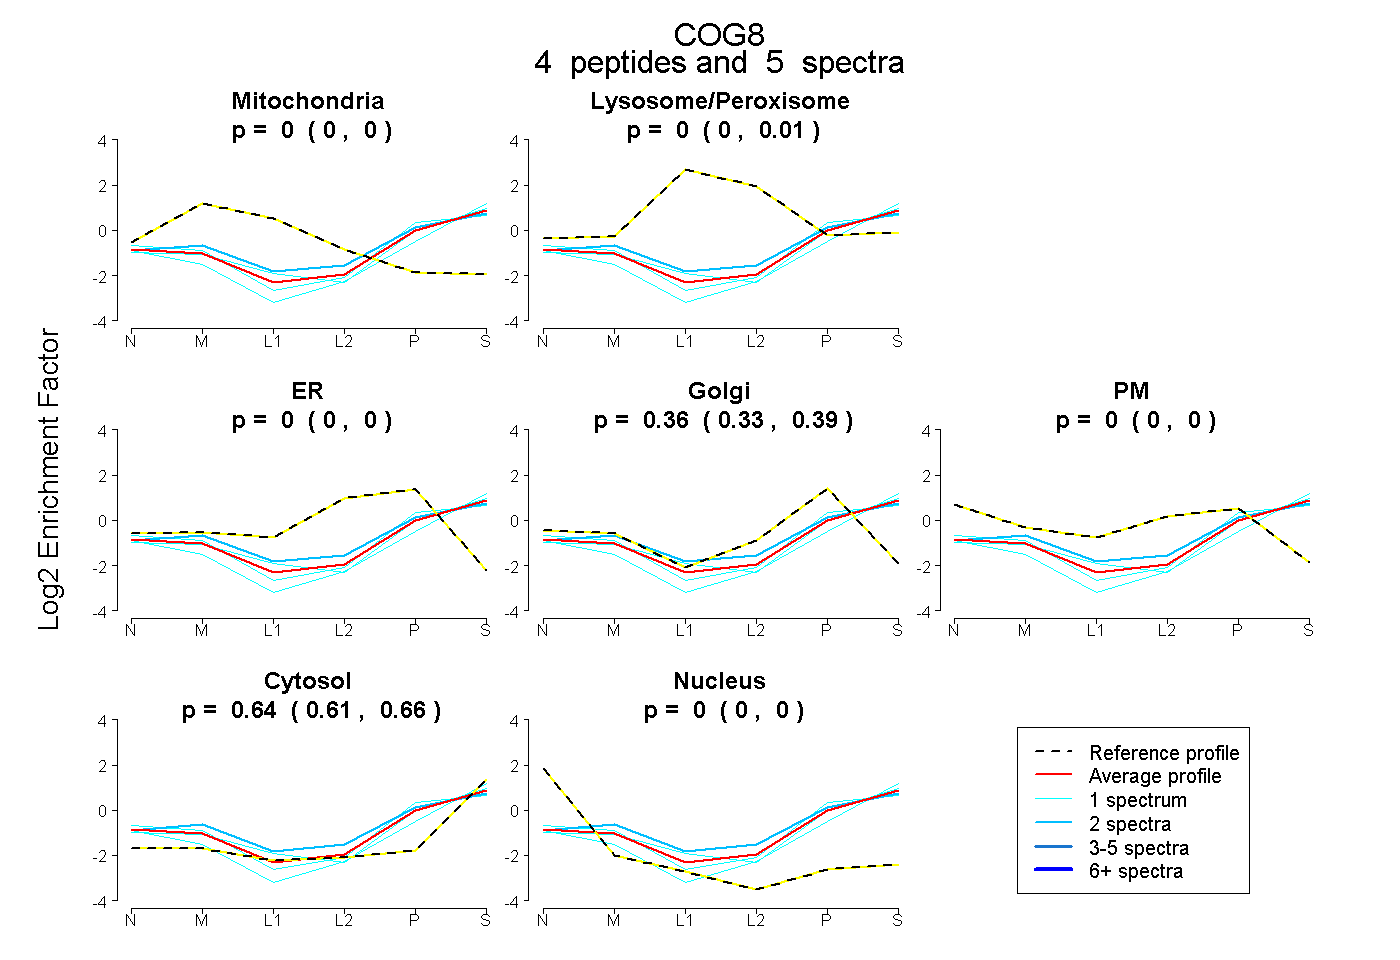 |
0.000 0.000 | 0.000 |
0.000 0.000 | 0.009 |
0.000 0.000 | 0.000 |
0.363 0.334 | 0.386 |
0.000 0.000 | 0.000 |
0.637 0.609 | 0.658 |
0.000 0.000 | 0.000 |
|||
| Plot | Lyso | Other | |||||||||||
| Expt C |
2 peptides |
4 spectra |
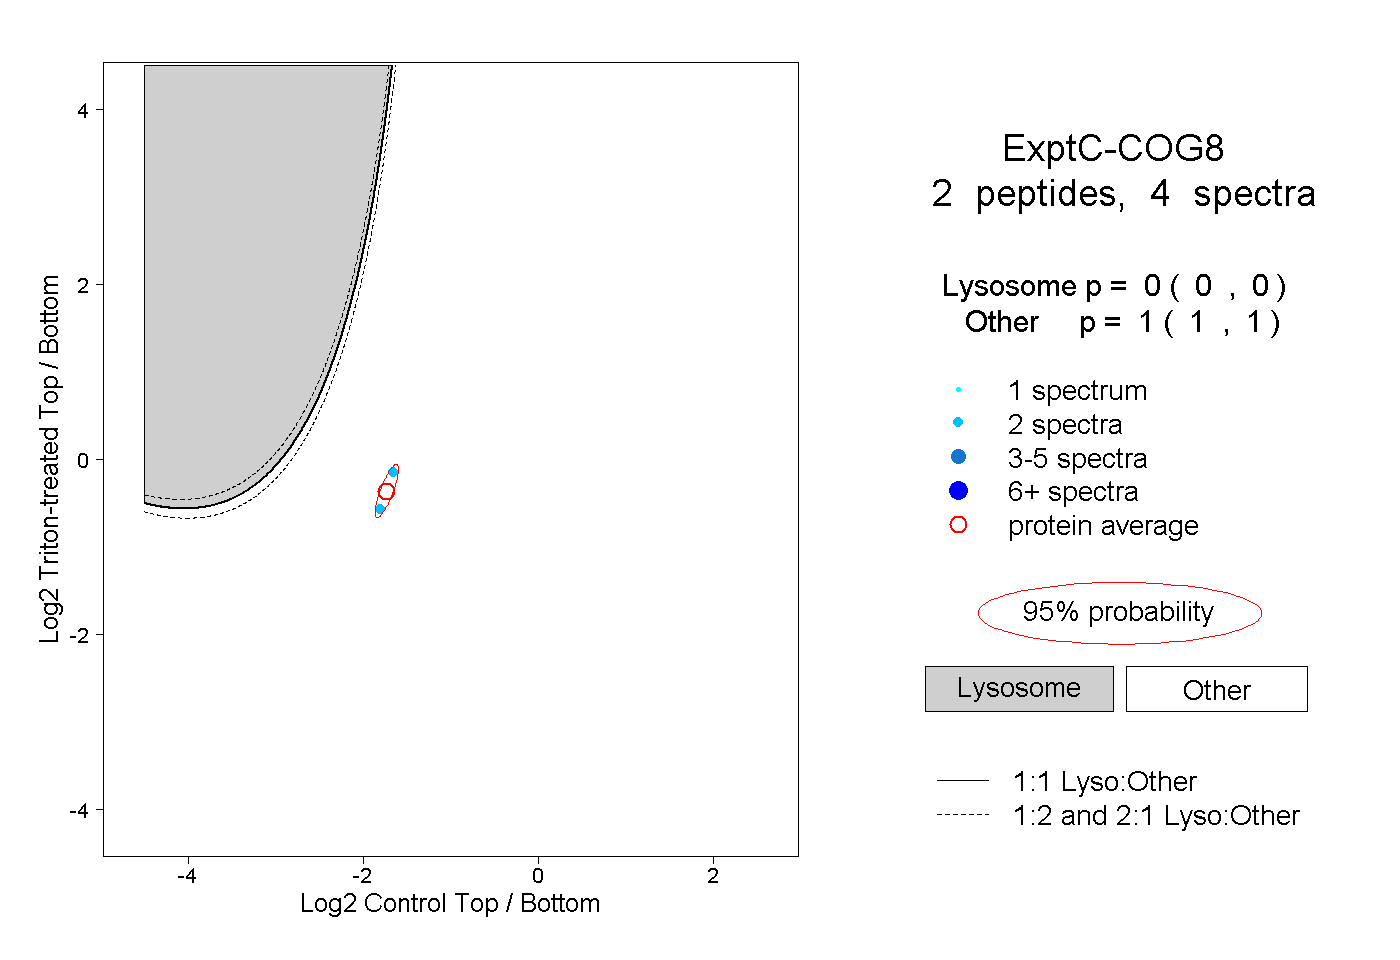 |
0.000 0.000 | 0.000 |
1.000 1.000 | 1.000 |