 3
3peptides
spectra
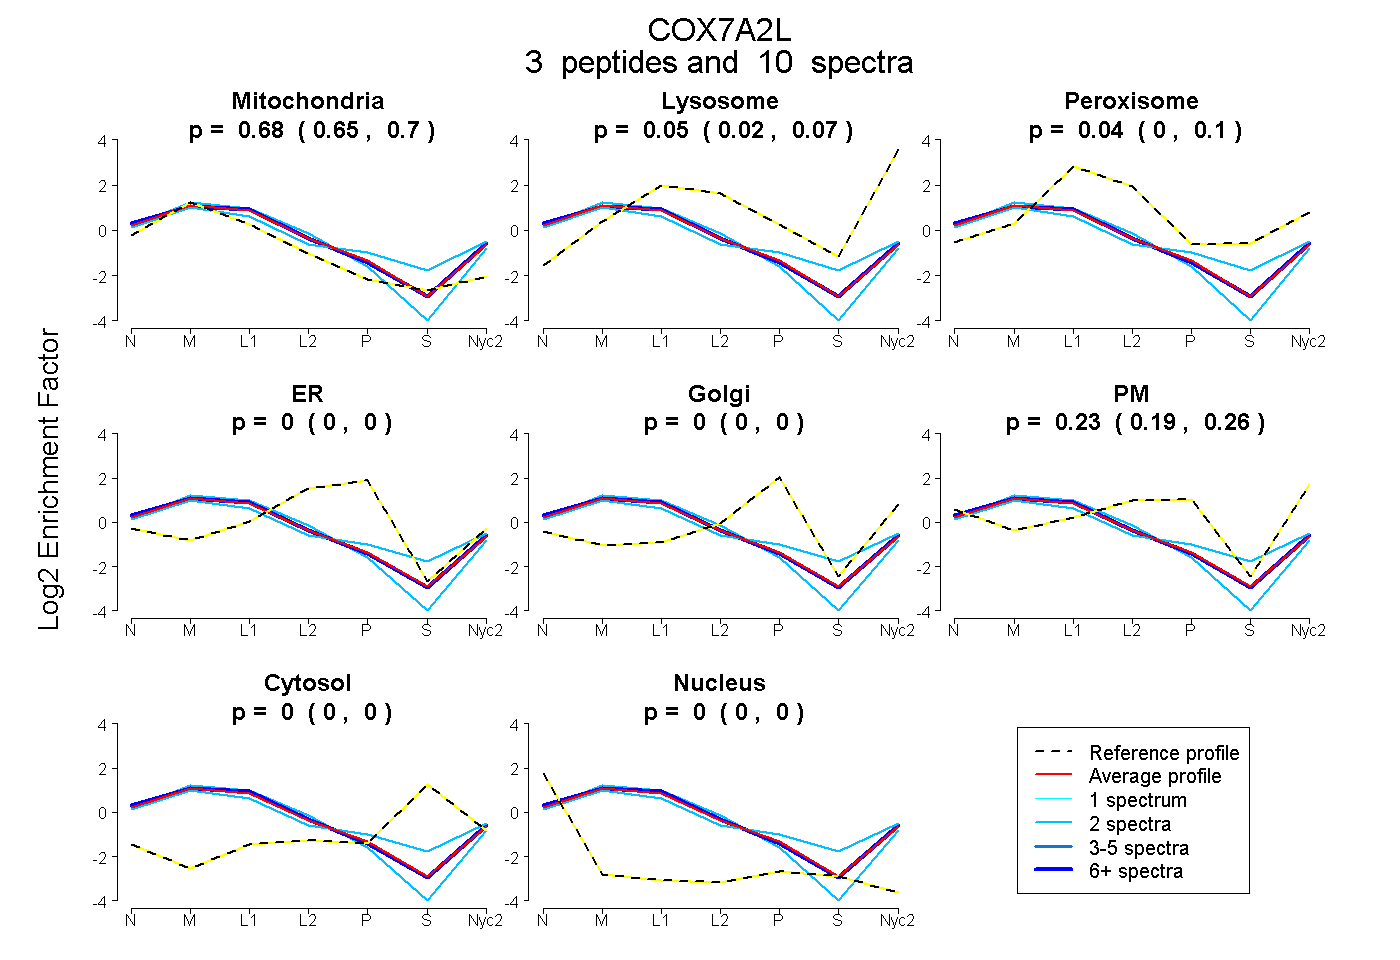
0.654 | 0.700
0.022 | 0.066
0.000 | 0.100
0.000 | 0.000
0.000 | 0.000
0.191 | 0.262
0.000 | 0.000
0.000 | 0.000
4peptides
spectra
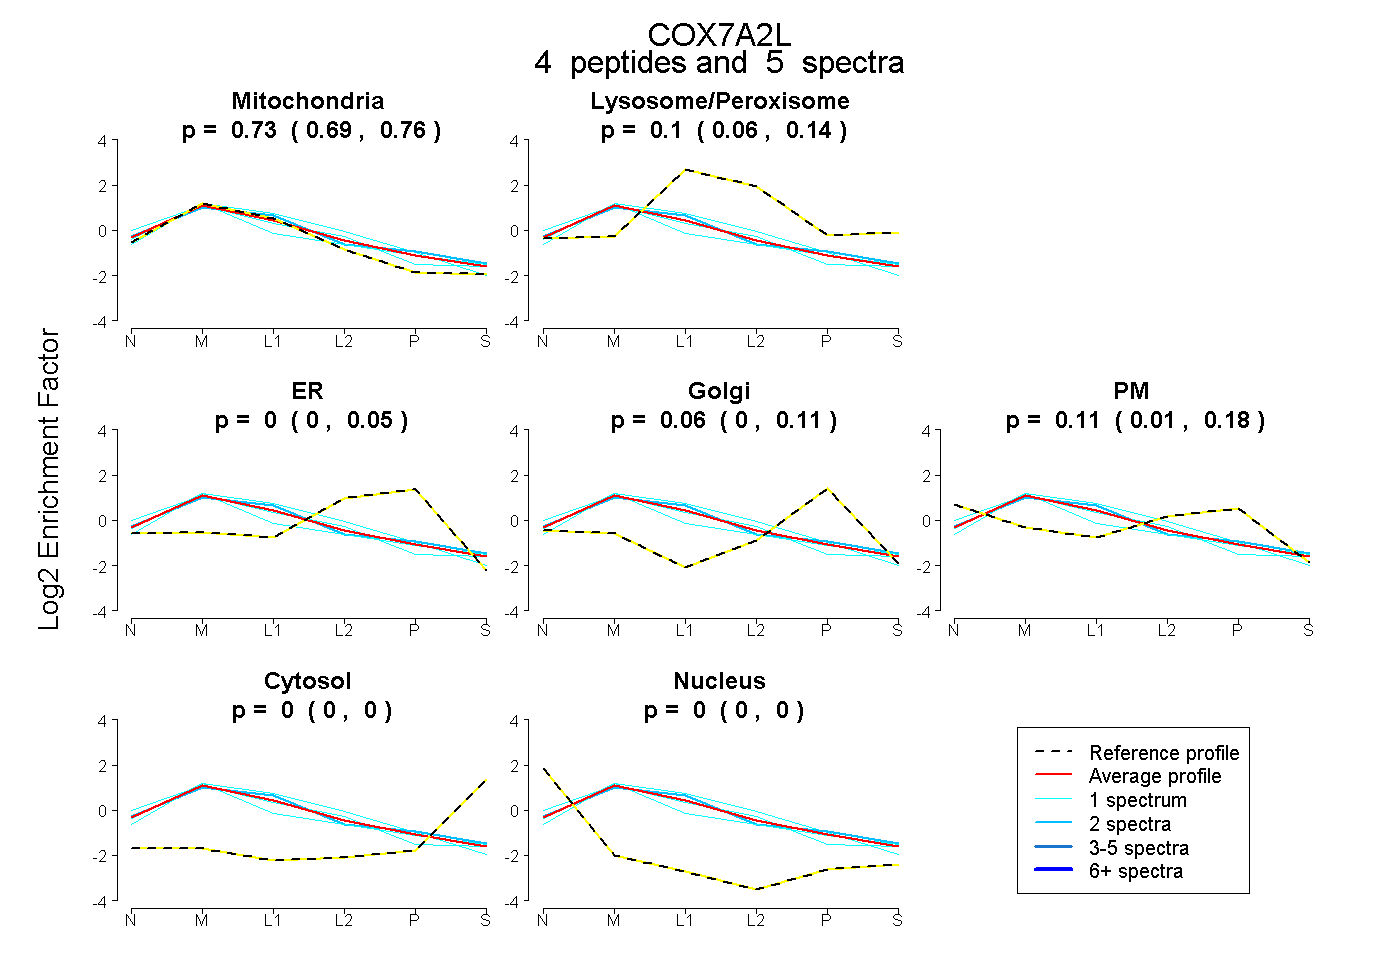
0.693 | 0.765
0.056 | 0.137
0.000 | 0.052
0.000 | 0.113
0.006 | 0.182
0.000 | 0.000
0.000 | 0.000
4peptides
spectra
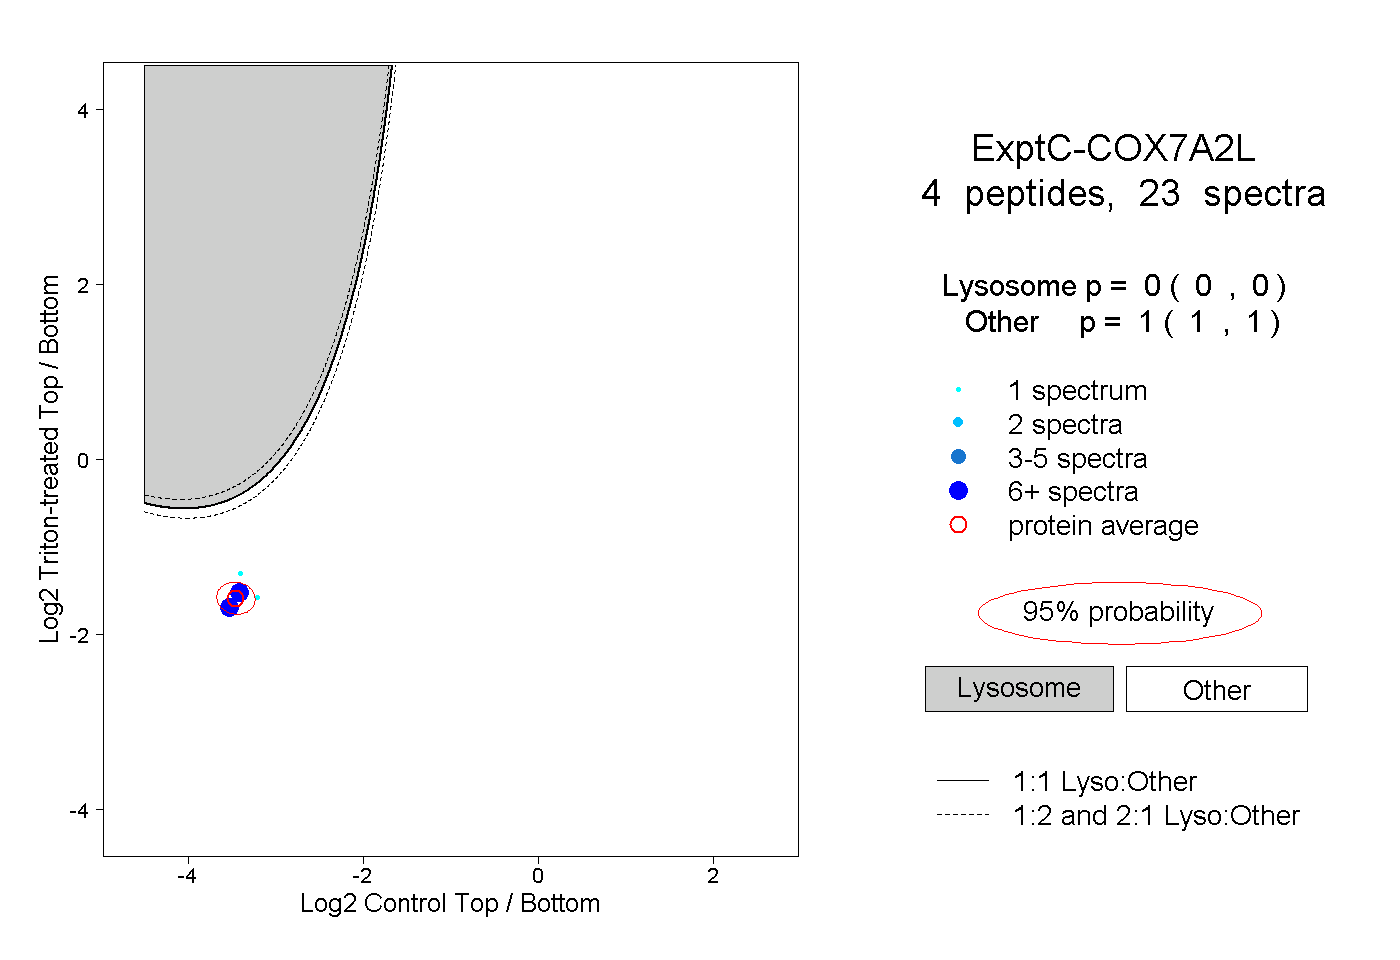
0.000 | 0.000
1.000 | 1.000
1peptide
spectrum
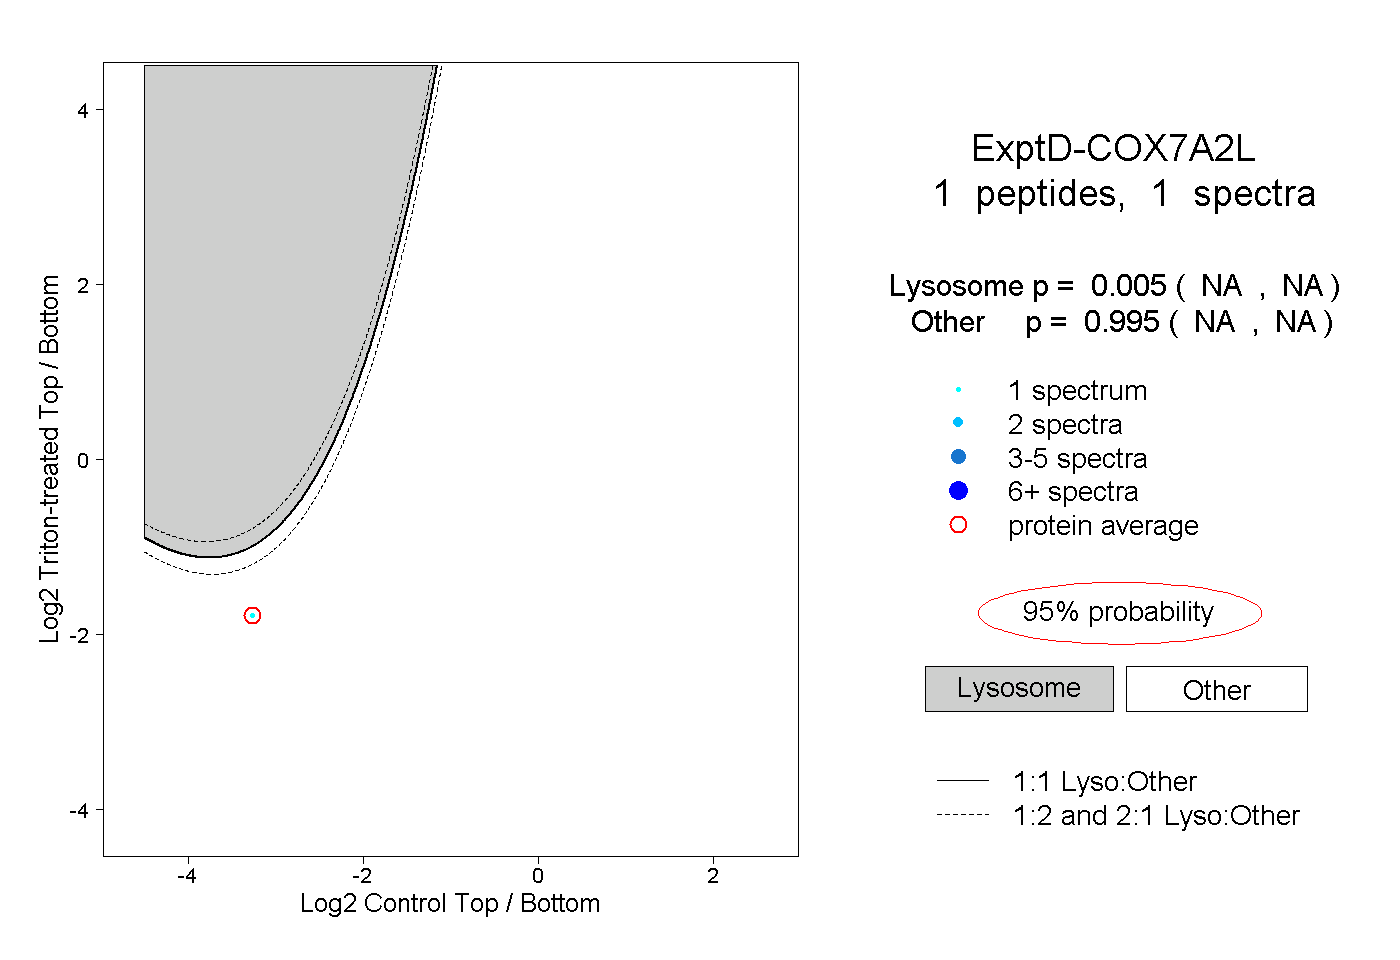
NA | NA
NA | NA