 3
3peptides
spectra
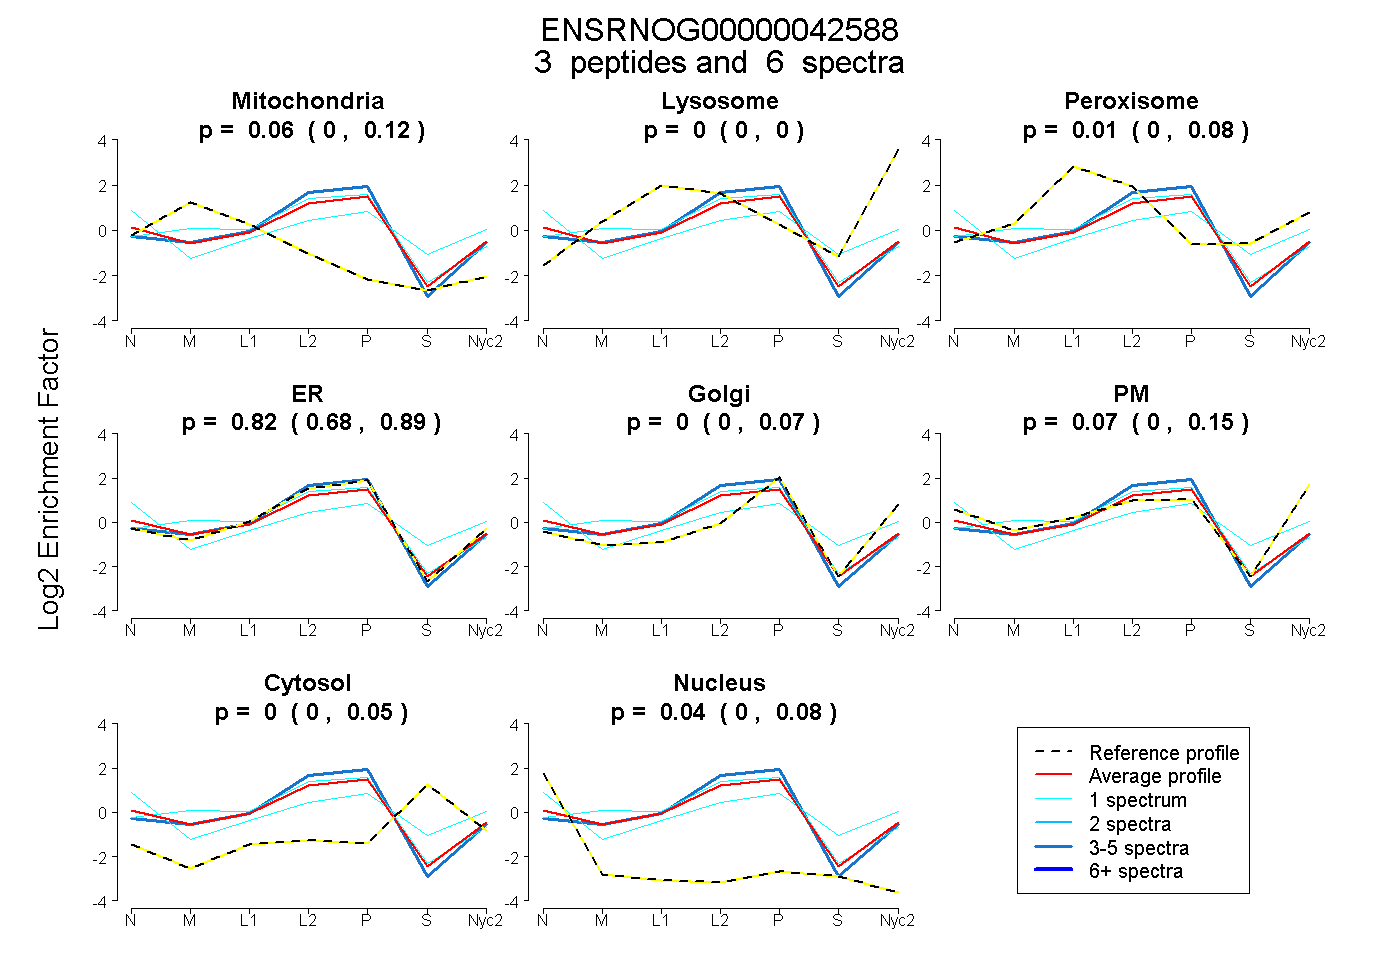
0.000 | 0.121
0.000 | 0.000
0.000 | 0.077
0.682 | 0.892
0.000 | 0.070
0.000 | 0.153
0.000 | 0.045
0.000 | 0.084
1peptide
spectra
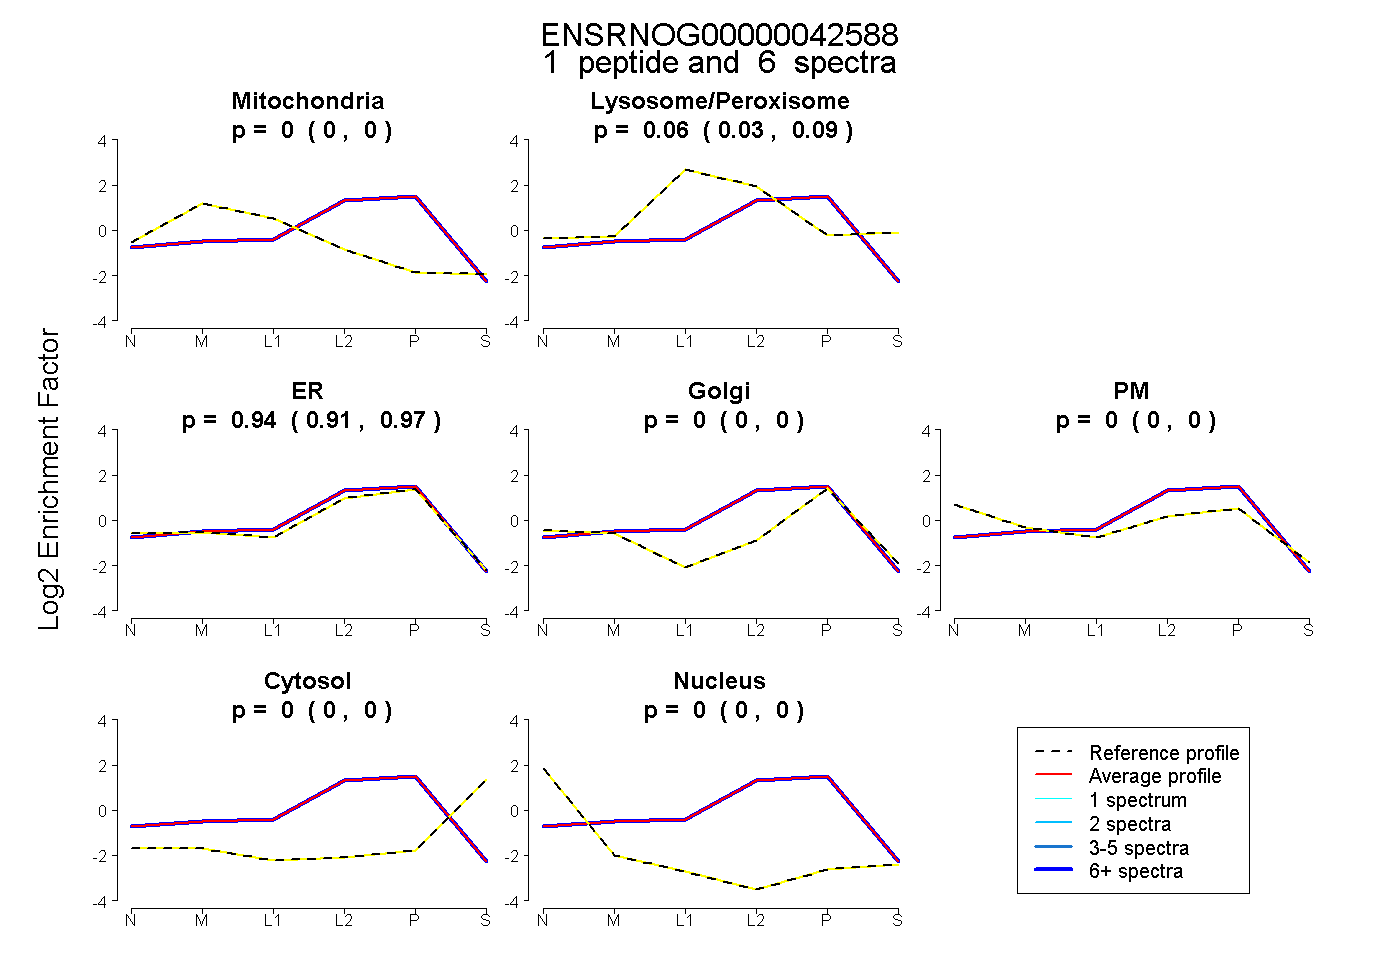
0.000 | 0.000
0.027 | 0.090
0.905 | 0.967
0.000 | 0.000
0.000 | 0.000
0.000 | 0.000
0.000 | 0.000
2peptides
spectra
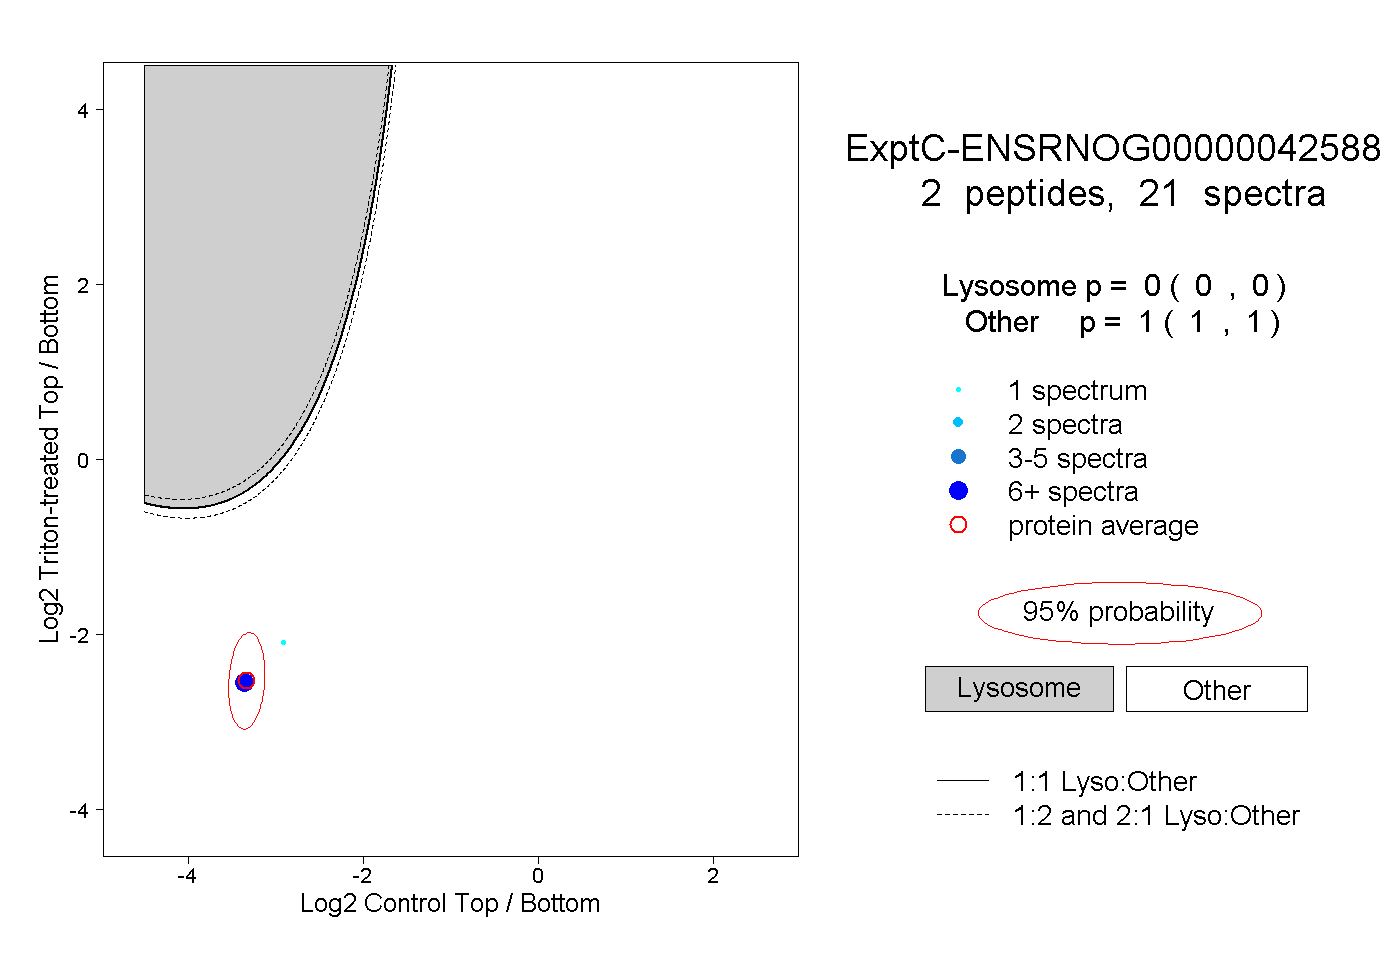
0.000 | 0.000
1.000 | 1.000
1peptide
spectra
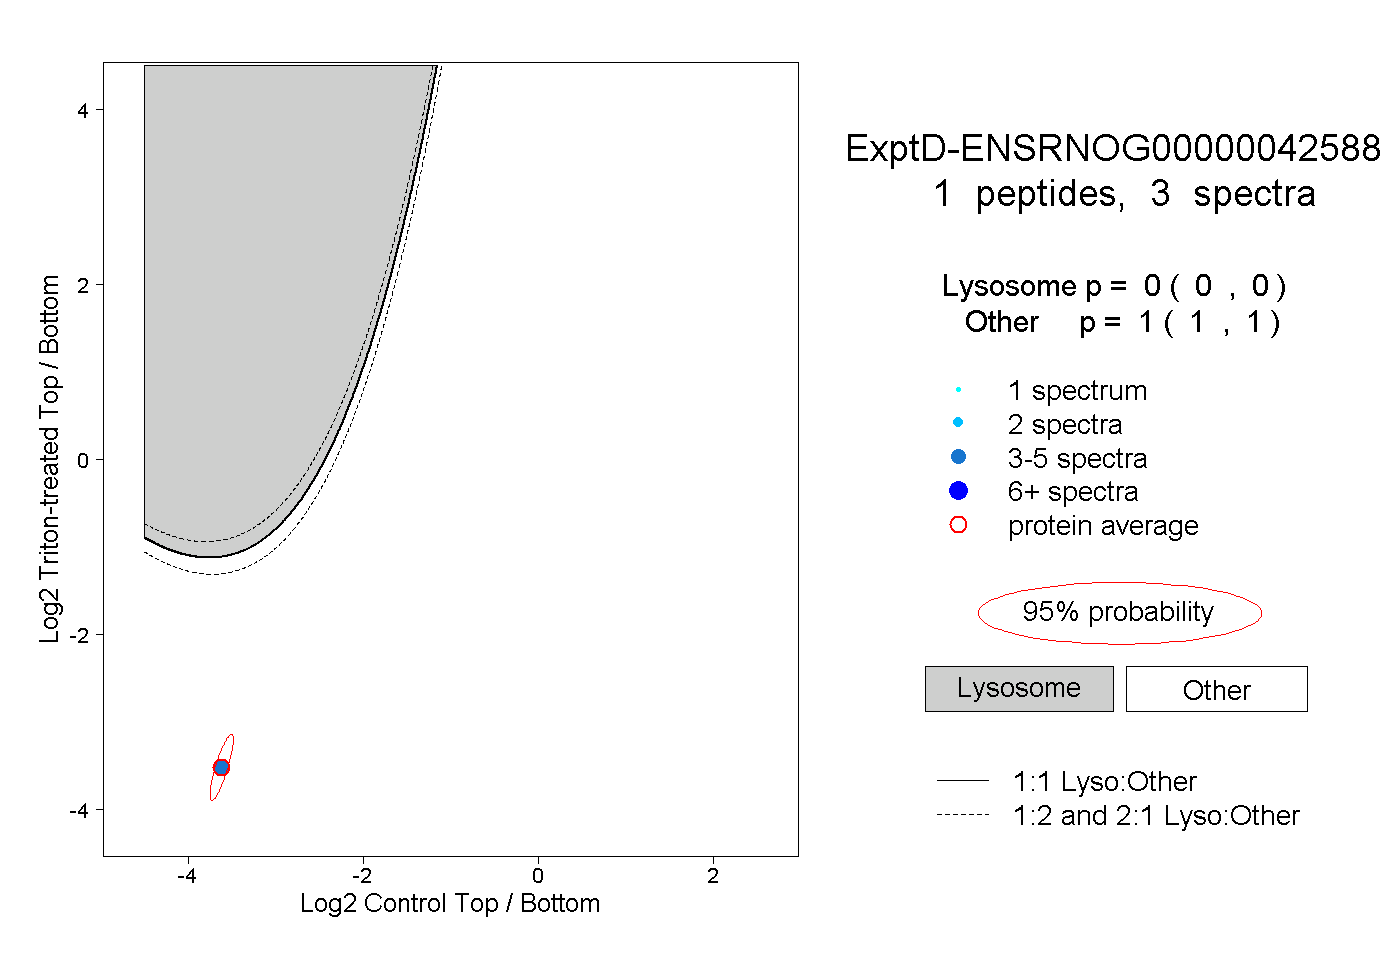
0.000 | 0.000
1.000 | 1.000