 10
10peptides
spectra

0.142 | 0.169
0.000 | 0.000
0.102 | 0.153
0.475 | 0.563
0.094 | 0.166
0.005 | 0.095
0.000 | 0.000
0.000 | 0.000
6peptides
spectra
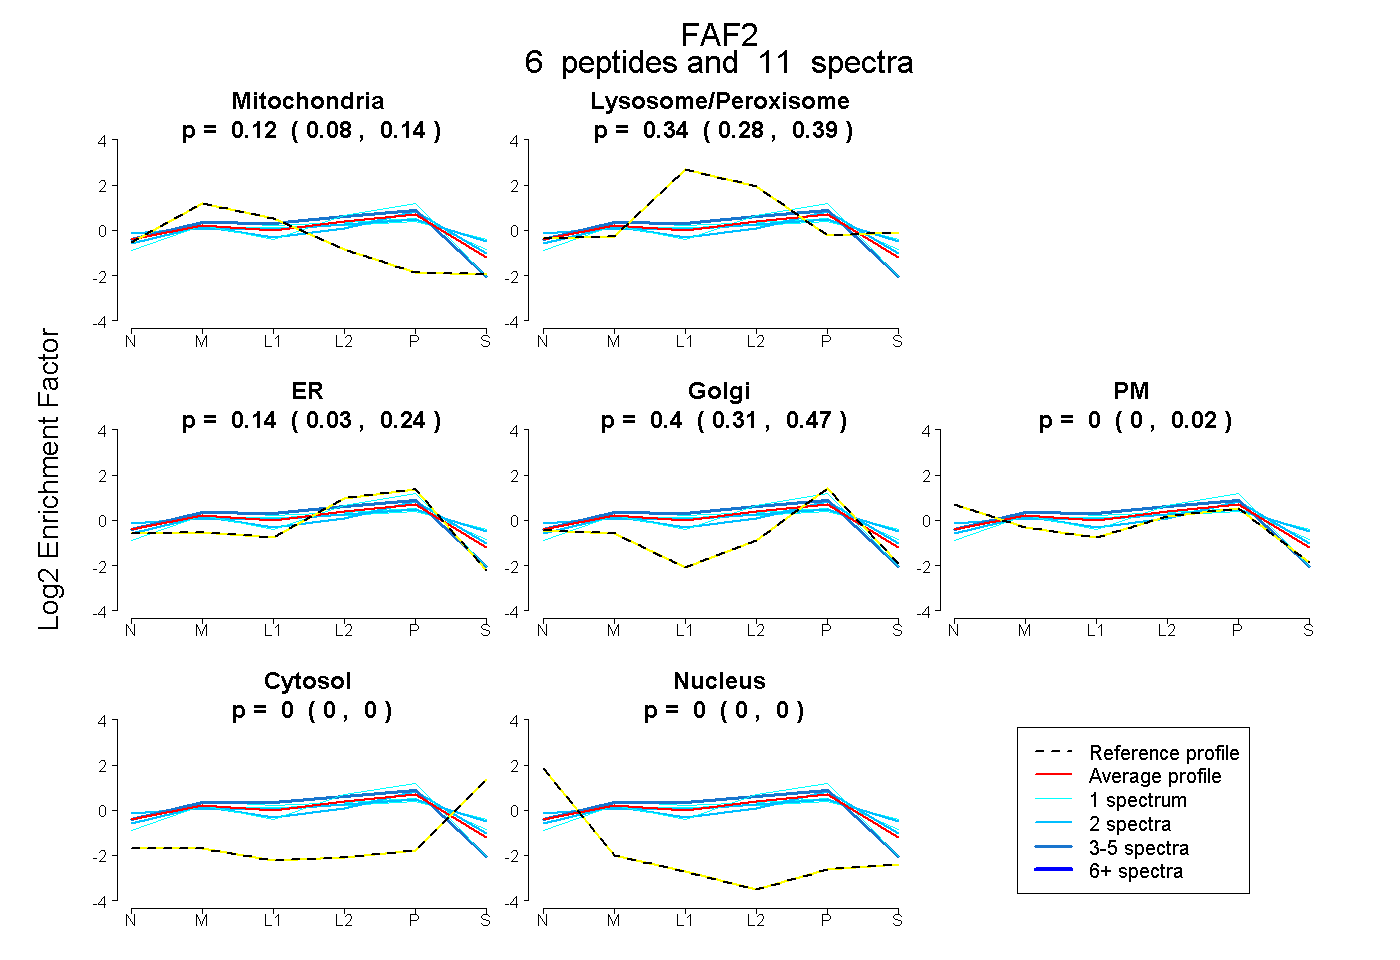
0.080 | 0.145
0.279 | 0.386
0.029 | 0.239
0.309 | 0.475
0.000 | 0.021
0.000 | 0.000
0.000 | 0.000

