 10
10peptides
spectra

0.142 | 0.169
0.000 | 0.000
0.102 | 0.153
0.475 | 0.563
0.094 | 0.166
0.005 | 0.095
0.000 | 0.000
0.000 | 0.000
| Plot | Mito | Lyso | Perox | ER | Golgi | PM | Cytosol | Nucleus | |||||
| Expt A |
10 peptides |
28 spectra |
|
0.157 0.142 | 0.169 |
0.000 0.000 | 0.000 |
0.132 0.102 | 0.153 |
0.524 0.475 | 0.563 |
0.134 0.094 | 0.166 |
0.053 0.005 | 0.095 |
0.000 0.000 | 0.000 |
0.000 0.000 | 0.000 |
| 2 spectra, EEEVQQQK | 0.018 | 0.000 | 0.318 | 0.246 | 0.150 | 0.052 | 0.216 | 0.000 | ||
| 2 spectra, ENTYPFLAMIMLK | 0.149 | 0.013 | 0.000 | 0.764 | 0.000 | 0.074 | 0.000 | 0.000 | ||
| 4 spectra, FQIEANFPR | 0.103 | 0.142 | 0.000 | 0.298 | 0.142 | 0.316 | 0.000 | 0.000 | ||
| 7 spectra, LPNDSR | 0.245 | 0.000 | 0.000 | 0.755 | 0.000 | 0.000 | 0.000 | 0.000 | ||
| 3 spectra, MTVVGR | 0.144 | 0.000 | 0.228 | 0.363 | 0.185 | 0.080 | 0.000 | 0.000 | ||
| 1 spectrum, FLLVYLHGDDHQDSDEFCR | 0.023 | 0.000 | 0.362 | 0.000 | 0.491 | 0.091 | 0.033 | 0.000 | ||
| 2 spectra, VSQALR | 0.039 | 0.103 | 0.288 | 0.009 | 0.366 | 0.195 | 0.000 | 0.000 | ||
| 2 spectra, NQTQVLR | 0.125 | 0.046 | 0.056 | 0.555 | 0.218 | 0.000 | 0.000 | 0.000 | ||
| 3 spectra, QQQDEAYLASLR | 0.193 | 0.000 | 0.034 | 0.754 | 0.000 | 0.019 | 0.000 | 0.000 | ||
| 2 spectra, MLFWACSTNKPEGYR | 0.325 | 0.000 | 0.000 | 0.675 | 0.000 | 0.000 | 0.000 | 0.000 |
| Plot | Mito | Lyso or Perox | ER | Golgi | PM | Cytosol | Nucleus | ||||||
| Expt B |
6 peptides |
11 spectra |
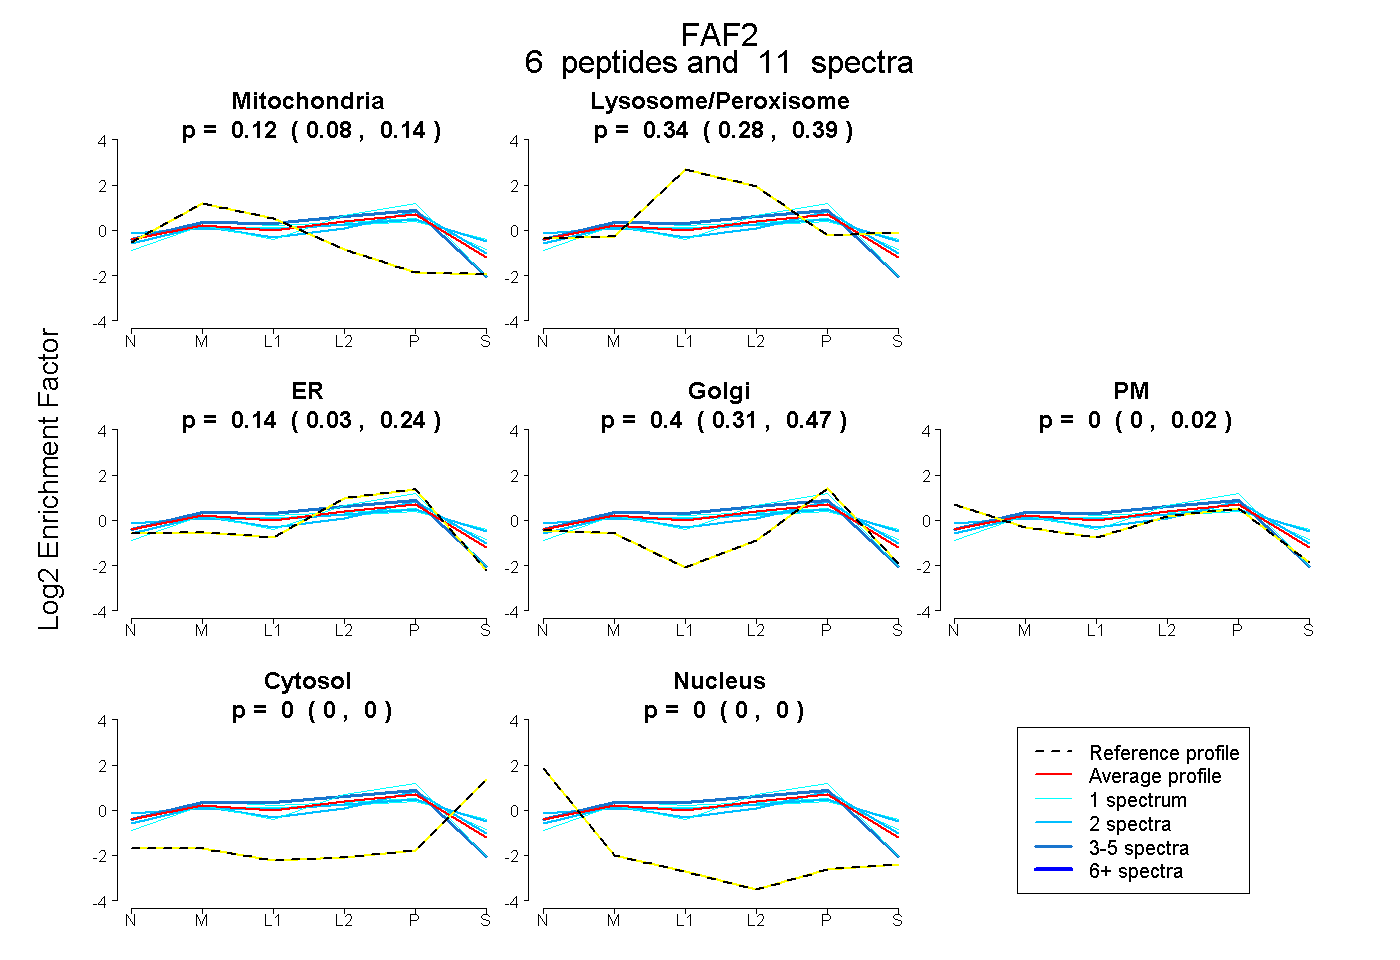 |
0.115 0.080 | 0.145 |
0.338 0.279 | 0.386 |
0.143 0.029 | 0.239 |
0.403 0.309 | 0.475 |
0.000 0.000 | 0.021 |
0.000 0.000 | 0.000 |
0.000 0.000 | 0.000 |
|||
| Plot | Lyso | Other | |||||||||||
| Expt C |
11 peptides |
45 spectra |
 |
0.000 0.000 | 0.000 |
1.000 1.000 | 1.000 |
||||||||
| Plot | Lyso | Other | |||||||||||
| Expt D |
4 peptides |
7 spectra |
 |
0.000 0.000 | 0.000 |
1.000 1.000 | 1.000 |